Pregabalin Capsule
Product Images NDC 70518-3643

View Photos of Packaging, Regulatory Labels, and Product Appearance

Product Visual Gallery

This gallery contains 14 technical images submitted to the FDA as part of the official labeling for Pregabalin (NDC 70518-3643). Unlike standard consumer photos, these assets often include clinical data figures, molecular chemical structures, and official manufacturer packaging layouts.

As provided by Remedyrepack Inc., these visuals offer a comprehensive scientific overview of the product's physical and chemical identity, aiding pharmacists and researchers in product verification and study.

FDA Label Image

Remedy_label (Remedy Label)

Remedy_label (Remedy Label)
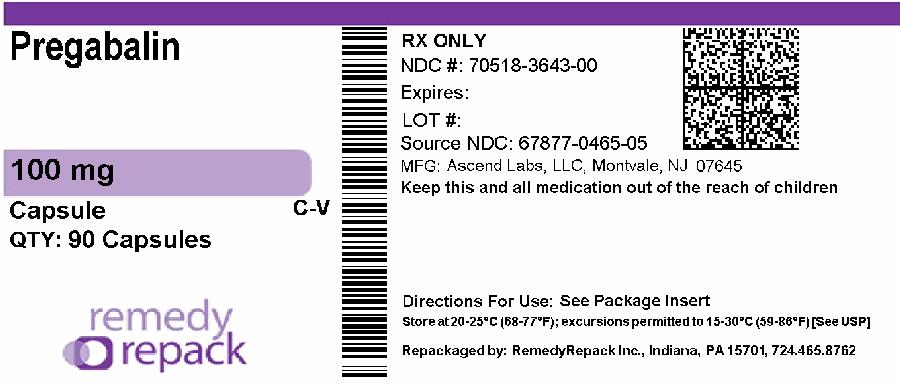
This is a description of a medication called Pregabalin in form of 100 mg capsules, with 90 capsules included in the package. The medication is only available with a prescription and has an NDC number of 70518-3642-00. The manufacturer of the medication is Ascend Labs LLC located in Montvale, NJ. The storage directions advise to keep the medication out of reach of children and store it between 20-25°C (88-77°F), with excursions permitted o 15-30°C (59-86°F). The repackaging of the medication was done by RemedyRepack Inc., located in Indiana, PA. The package insert should also be consulted for the directions for use.*
FDA Label Image

Pregabalin-equation (Pregabalin Equation)

Pregabalin-equation (Pregabalin Equation)
This appears to be a formula for calculating the creatinine clearance rate (CLCr) for female patients based on their age, weight, and serum creatinine levels. However, without additional context or instructions on how to use the formula, it is difficult to provide a more detailed description or interpretation.*
FDA Label Image

Pregabalin-figure-6 (Pregabalin Figure 6)

Pregabalin-figure-6 (Pregabalin Figure 6)
This appears to be tabular data from two study experiments (E1 and E3) evaluating a treatment (possibly a medication) at different doses (50mg, 150mg, 300mg, 600mg). The data includes results such as percentages of improvement or response rate. The placebo group is also included for comparison, and some of the results are labeled as statistically significant compared to the placebo.*
FDA Label Image

Pregabalin-figure-7 (Pregabalin Figure 7)

FDA Label Image

Study Dpn 1 (Pregabalin Image 1)

FDA Label Image

Study Sci 1 (Pregabalin Image 10)

FDA Label Image

Pain Intensity-study Sci 2 (Pregabalin Image 11)

FDA Label Image

Study Dpn 2 (Pregabalin Image 2)

FDA Label Image

Study Phn 1 (Pregabalin Image 3)

FDA Label Image

Study Phn 2 (Pregabalin Image 4)

Study Phn 2 (Pregabalin Image 4)
Percentage improvement in pain from baseline is available, but there is not enough context to provide a useful description.*
FDA Label Image

Study Phn 3 (Pregabalin Image 5)

FDA Label Image

Fibromyalgia Study F1 (Pregabalin Image 8)

Fibromyalgia Study F1 (Pregabalin Image 8)
This is a data sheet showing the percentage of patients that improved their pain levels with different doses of Pregabalin compared to a placebo. The improvement in pain is shown in a chart. The text indicates the percentage of improvement for each dose, ranging from 20% to 100%.*
FDA Label Image

Fibromyalgia Study F2 (Pregabalin Image 9)

FDA Label Image

Pregabalin Structure (Pregabalin Srtuc 1)

* These product label images have been analyzed using experimental machine learning. Please verify findings with the primary label text.