Levetiracetam Tablet
Product Images NDC 70518-4013

View Photos of Packaging, Regulatory Labels, and Product Appearance

Product Visual Gallery

This gallery contains 8 technical images submitted to the FDA as part of the official labeling for Levetiracetam (NDC 70518-4013). Unlike standard consumer photos, these assets often include clinical data figures, molecular chemical structures, and official manufacturer packaging layouts.

As provided by Remedyrepack Inc., these visuals offer a comprehensive scientific overview of the product's physical and chemical identity, aiding pharmacists and researchers in product verification and study.

FDA Label Image

Remedy_label (Remedy Label)

Remedy_label (Remedy Label)
Levetiracetam 750 mg oral tablet label showing a quantity of 30 tablets. The label includes the REMEDYREPACK INC. logo and mentions Tris Pharma, Inc. as the manufacturer. It displays the NDC number 70518-4013-00, storage instructions, and repackager information from RemedyRepack Inc., Indiana, PA.*
FDA Label Image

Structure Formula (Levetiracetam Tablets 1)

Structure Formula (Levetiracetam Tablets 1)
Chemical structure of levetiracetam, showing its molecular framework with a pyrrolidone ring and functional groups including an amide and ethyl side chain.*
FDA Label Image

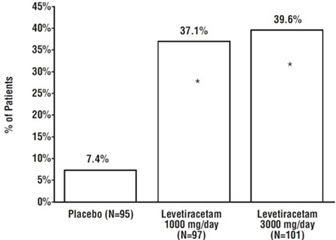
Figure 1 (Levetiracetam Tablets 2)

Figure 1 (Levetiracetam Tablets 2)
A bar chart comparing the percentage of patients among three groups: Placebo (7.4%), Levetiracetam 1000 mg/day, and Levetiracetam 3000 mg/day, with the latter two showing higher percentages around 37.1% and 39.6%, respectively. The chart shows the treatment groups along the x-axis and percentage of patients on the y-axis.*
FDA Label Image

Figure2 (Levetiracetam Tablets 3)

Figure2 (Levetiracetam Tablets 3)
Bar chart depicting the percentage of patients in three groups: Placebo (6.3%), Levetiracetam 1000 mg/day (20.8%), and Levetiracetam 2000 mg/day (35.2%). The graph compares patient response percentages across these treatment groups.*
FDA Label Image

Figure3 (Levetiracetam Tablets 4)

Figure3 (Levetiracetam Tablets 4)
A bar chart comparing the percentage of patients between placebo and Levetiracetam 3000 mg/day groups. The vertical axis represents the percentage of patients, with placebo at 14.4% and Levetiracetam at 39.4%, illustrating a difference in outcomes between the two groups.*
FDA Label Image

Figure4 (Levetiracetam Tablets 5)

Figure4 (Levetiracetam Tablets 5)
A bar chart comparing the percentage of patients between a placebo group and a Levetiracetam group. The placebo group (N=97) shows 19.6% of patients, while the Levetiracetam group (N=101) shows 44.6% of patients. The y-axis represents the percentage of patients from 0% to 45%.*
FDA Label Image

Figure5 (Levetiracetam Tablets 6)

Figure5 (Levetiracetam Tablets 6)
A bar chart comparing the percentage of patients in two groups: Placebo (N=51) at 19.6% and Levetiracetam (N=58) at 43.1%. The y-axis represents the percentage of patients, ranging from 0% to 45%.*
FDA Label Image

Figure6 (Levetiracetam Tablets 7)

Figure6 (Levetiracetam Tablets 7)
A bar graph comparing the percentage of patients between a placebo group (N=84) and a levetiracetam group (N=79). The y-axis represents the percentage of patients from 0% to 100%. The placebo bar shows approximately 45.2%, while the levetiracetam bar shows approximately 72.2%, with a marked significant difference.*

* About these descriptions: Image descriptions on this page are generated by automated AI analysis of the product label images from the manufacturer's FDA label submission (SPL). They are provided for reference only and may contain errors or omissions. Always rely on the printed label itself and the official FDA labeling, and consult a pharmacist or healthcare professional with any questions about this product.