Rosuvastatin Tablet, Film Coated
Product Images NDC 70518-4314

View Photos of Packaging, Regulatory Labels, and Product Appearance

Product Visual Gallery

This gallery contains 5 technical images submitted to the FDA as part of the official labeling for Rosuvastatin (NDC 70518-4314). Unlike standard consumer photos, these assets often include clinical data figures, molecular chemical structures, and official manufacturer packaging layouts.

As provided by Remedyrepack Inc., these visuals offer a comprehensive scientific overview of the product's physical and chemical identity, aiding pharmacists and researchers in product verification and study.

FDA Label Image

Remedy_label (Remedy Label)
Remedy_label (Remedy Label)
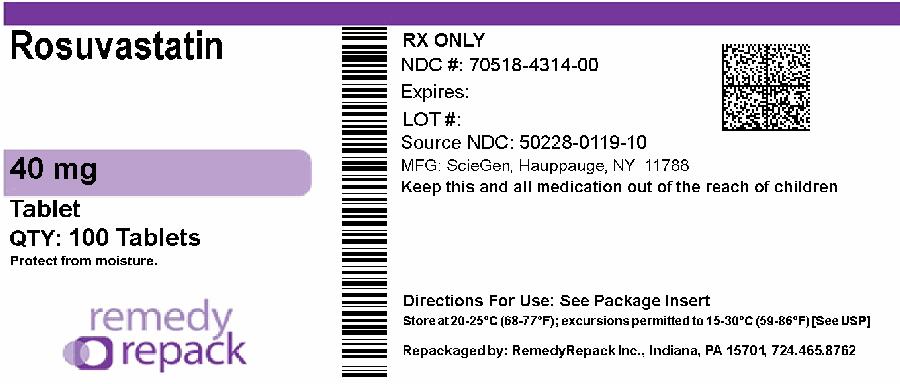
Rosuvastatin 40 mg film coated tablet label showing a quantity of 100 tablets. The label includes dosage form, quantity, manufacturer information (ScieGen, Hauppauge, NY), and repackager RemedyRepack Inc., Indiana, PA. It also contains storage instructions and a barcode.*
FDA Label Image

Figure-01 (Figure 1)

Figure-01 (Figure 1)
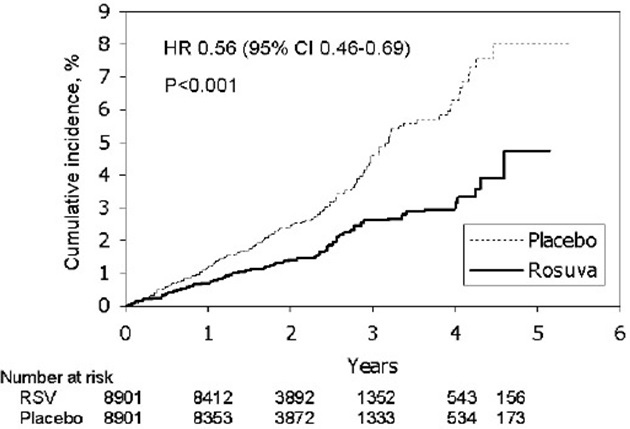
A cumulative incidence chart comparing Rosuvastatin (solid line) and Placebo (dotted line) over a period of up to 5 years. The graph shows lower cumulative incidence in the Rosuvastatin group versus Placebo, with hazard ratio (HR) 0.56 and 95% confidence interval (CI) of 0.46-0.69. Number at risk for each group is listed below the x-axis.*
FDA Label Image

Figure-02 (Figure 2)

Figure-02 (Figure 2)
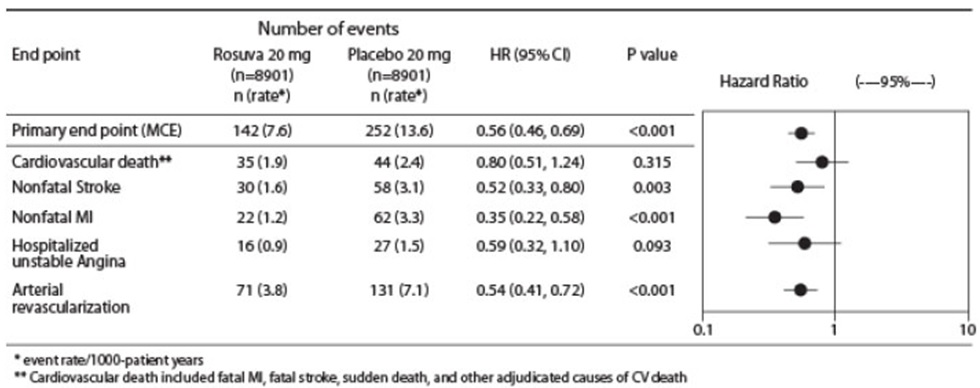
A table presenting clinical trial data comparing Rosuvastatin 20 mg versus placebo 20 mg across various cardiovascular endpoints. It lists the number of events and event rates per 1000 patient-years for each group, hazard ratios with 95% confidence intervals, and P values. Included endpoints are primary endpoint (MCE), cardiovascular death, nonfatal stroke, nonfatal myocardial infarction, hospitalized unstable angina, and arterial revascularization, accompanied by a corresponding hazard ratio forest plot.*
FDA Label Image

Figure-02 (Figure 3)

Figure-02 (Figure 3)
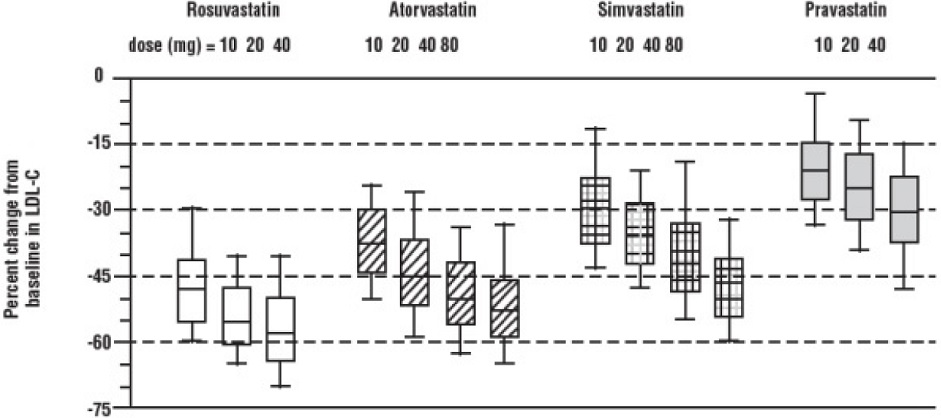
A box plot chart comparing percent change from baseline in LDL-C for four statin drugs (Rosuvastatin, Atorvastatin, Simvastatin, Pravastatin) at various doses (10, 20, 40 mg, with Atorvastatin and Simvastatin also at 80 mg). The y-axis shows percent change from 0 to -75, illustrating efficacy variation by dose and drug type.*
FDA Label Image

Structural Formula (Rosuvastatin Str)

Structural Formula (Rosuvastatin Str)
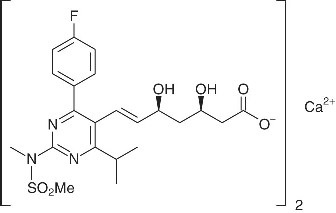
Chemical structure of rosuvastatin calcium, showing its molecular framework with functional groups and calcium ions, as depicted in the product labeling.*

* About these descriptions: Image descriptions on this page are generated by automated AI analysis of the product label images from the manufacturer's FDA label submission (SPL). They are provided for reference only and may contain errors or omissions. Always rely on the printed label itself and the official FDA labeling, and consult a pharmacist or healthcare professional with any questions about this product.