Quetiapine Tablet, Extended Release
Product Images NDC 70518-4437

View Photos of Packaging, Regulatory Labels, and Product Appearance

Product Visual Gallery

This gallery contains 5 technical images submitted to the FDA as part of the official labeling for Quetiapine (NDC 70518-4437). Unlike standard consumer photos, these assets often include clinical data figures, molecular chemical structures, and official manufacturer packaging layouts.

As provided by Remedyrepack Inc., these visuals offer a comprehensive scientific overview of the product's physical and chemical identity, aiding pharmacists and researchers in product verification and study.

FDA Label Image

Remedy_label (Remedy Label)
Remedy_label (Remedy Label)
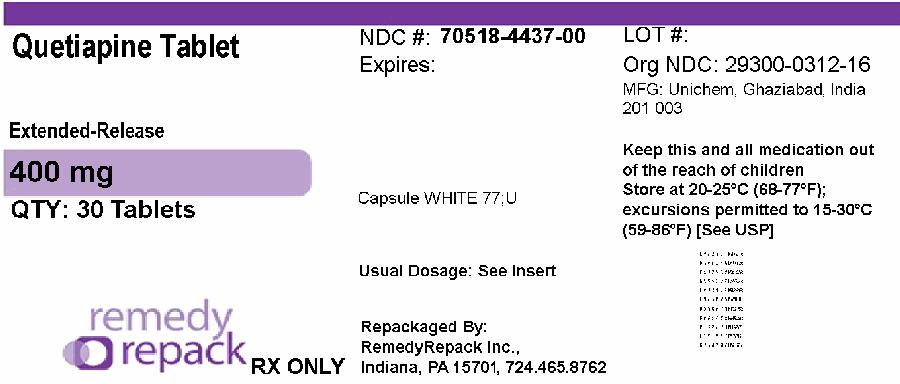
Quetiapine 400 mg extended-release tablets, quantity of 30 tablets per package. The label indicates the capsules are white and the product is for prescription use only. Manufactured by Unichem, Ghaziabad, India, and repackaged by RemedyRepack Inc., Indiana, PA. Storage instructions include keeping out of reach of children and storing at controlled room temperature.*
FDA Label Image

Image (C5ece454 9c87 42df A9f9 Fc9806d7c312 01)

Image (C5ece454 9c87 42df A9f9 Fc9806d7c312 01)
Chemical structure of quetiapine fumarate showing the quetiapine component along with fumaric acid in the molecular formula.*
FDA Label Image

Image (C5ece454 9c87 42df A9f9 Fc9806d7c312 02)

Image (C5ece454 9c87 42df A9f9 Fc9806d7c312 02)
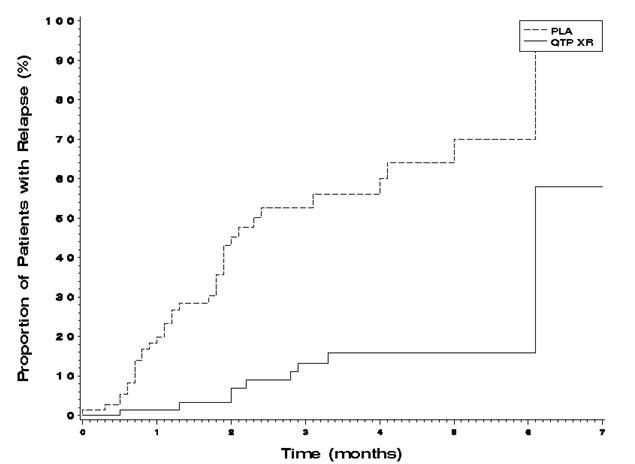
A line graph showing the proportion of patients with relapse (%) over time in months up to 7 months. Two lines are plotted: PLA with a dotted line showing a higher relapse rate over time, and QTP XR with a solid line depicting a lower relapse rate.*
FDA Label Image

Image (C5ece454 9c87 42df A9f9 Fc9806d7c312 03)

Image (C5ece454 9c87 42df A9f9 Fc9806d7c312 03)
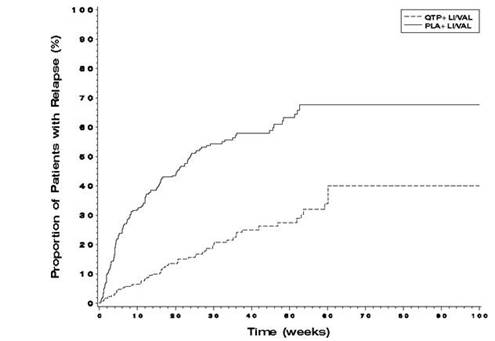
A line chart depicting the proportion of patients with relapse (%) over time (weeks) comparing two groups: QTP+LIVAL and PLA+LIVAL. The graph shows how relapse rates increase over a 100-week period for each group, with QTP+LIVAL exhibiting a lower relapse proportion than PLA+LIVAL throughout the timeline.*
FDA Label Image

Image (C5ece454 9c87 42df A9f9 Fc9806d7c312 04)

Image (C5ece454 9c87 42df A9f9 Fc9806d7c312 04)
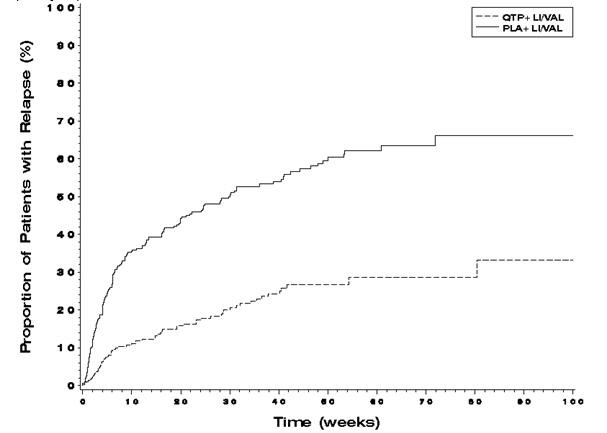
A line graph depicting the proportion of patients with relapse (%) over time (weeks) up to 100 weeks. Two curves are shown: one dashed line representing 'QTP+ LIVAL' and one solid line representing 'PLA+ LIVAL', illustrating the difference in relapse rates between these two groups over time.*

* About these descriptions: Image descriptions on this page are generated by automated AI analysis of the product label images from the manufacturer's FDA label submission (SPL). They are provided for reference only and may contain errors or omissions. Always rely on the printed label itself and the official FDA labeling, and consult a pharmacist or healthcare professional with any questions about this product.