Trintellix Tablet, Film Coated
Product Images NDC 70518-4483

View Photos of Packaging, Regulatory Labels, and Product Appearance

Product Visual Gallery

This gallery contains 12 technical images submitted to the FDA as part of the official labeling for Trintellix (NDC 70518-4483). Unlike standard consumer photos, these assets often include clinical data figures, molecular chemical structures, and official manufacturer packaging layouts.

As provided by Remedyrepack Inc., these visuals offer a comprehensive scientific overview of the product's physical and chemical identity, aiding pharmacists and researchers in product verification and study.

FDA Label Image

Remedy_label (Remedy Label)

Remedy_label (Remedy Label)
Trintellix 5 mg film-coated tablet label featuring the generic name vortioxetine. The label indicates a package quantity of 30 tablets per box and notes the product is repackaged by RemedyRepack Inc., Indiana, PA. Manufacturer is Takeda Pharma America, Inc., Deerfield, IL. Storage instructions and prescription-only notice are also present.*
FDA Label Image

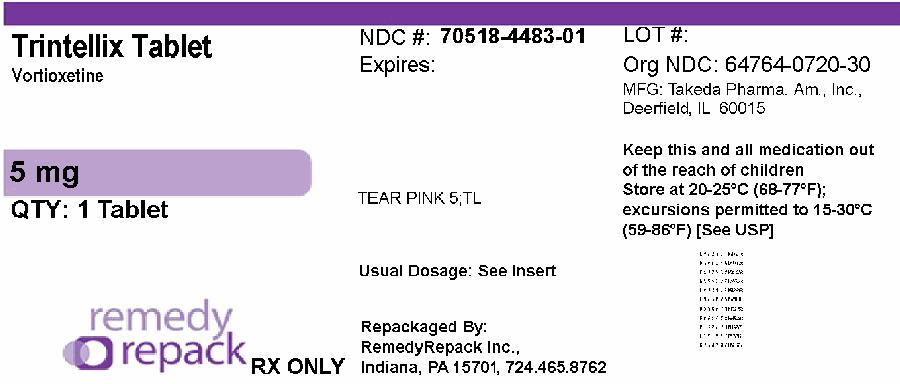
Mm2 (Trintellix 5mg 70518 4483 01)

Mm2 (Trintellix 5mg 70518 4483 01)
Label for Trintellix 5 mg vortioxetine tablet, film-coated, oral use. The label indicates a quantity of 1 tablet, repackaged by RemedyRepack Inc., with storage instructions and manufacturer information from Takeda Pharma America, Inc.*
FDA Label Image

Chemical Structure (Trintellix 01)

Chemical Structure (Trintellix 01)
Chemical structure diagram depicting the molecular structure of vortioxetine hydrobromide, the active ingredient in Trintellix 5 mg film-coated tablets by RemedyRepack Inc.*
FDA Label Image

Figure 1 (Trintellix 02)

Figure 1 (Trintellix 02)
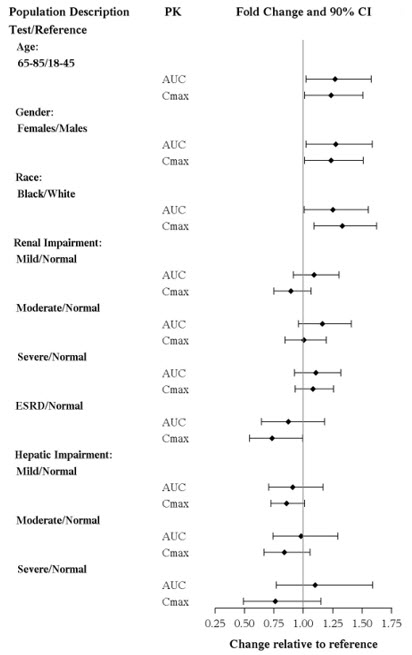
A forest plot illustrating pharmacokinetic fold change and 90% confidence intervals of AUC and Cmax for vortioxetine in different populations, including age groups, gender, race, renal impairment stages, end-stage renal disease, and hepatic impairment stages, compared to reference values. The x-axis represents the change relative to reference.*
FDA Label Image

Figure 2 (Trintellix 03)

Figure 2 (Trintellix 03)
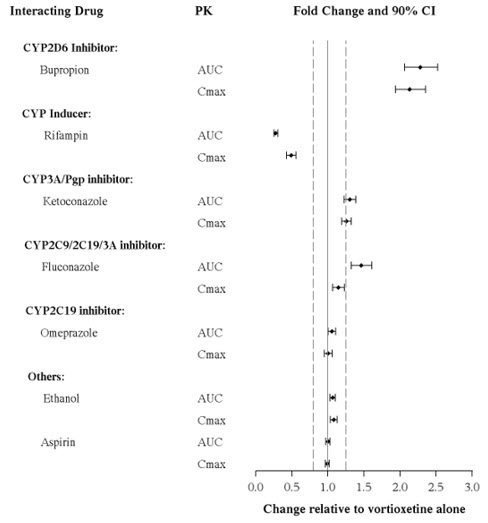
A forest plot illustrating the effect of various interacting drugs on vortioxetine pharmacokinetics, showing fold changes and 90% confidence intervals for AUC and Cmax relative to vortioxetine alone. Interacting drugs include CYP2D6 inhibitor bupropion, CYP inducer rifampin, CYP3A/Pgp inhibitor ketoconazole, CYP2C9/2C19/3A inhibitor fluconazole, CYP2C19 inhibitor omeprazole, and others such as ethanol and aspirin.*
FDA Label Image

Figure 3 (Trintellix 04)

Figure 3 (Trintellix 04)
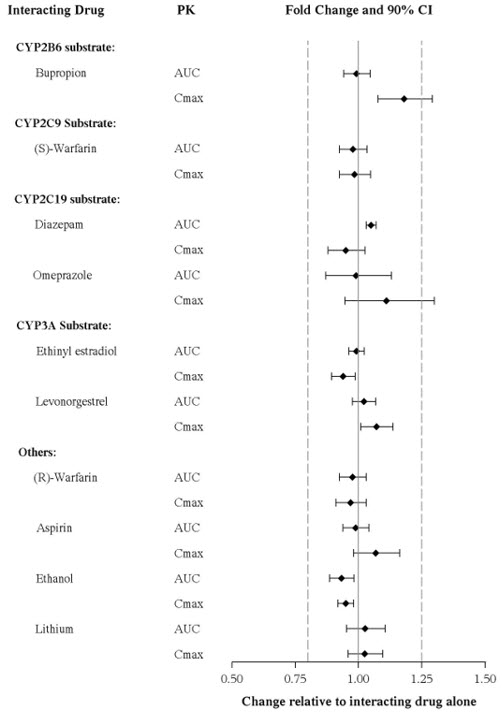
A forest plot chart showing the fold change and 90% confidence intervals for pharmacokinetic parameters (AUC and Cmax) of various interacting drugs when co-administered, relative to the drug alone. The chart includes substrates from CYP2B6, CYP2C9, CYP2C19, CYP3A, and others, plotting fold changes between 0.5 and 1.5 with a vertical line at 1 indicating no change.*
FDA Label Image

Figure 4 (Trintellix 05)

Figure 4 (Trintellix 05)
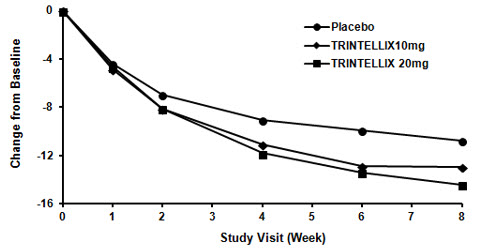
A line graph showing change from baseline over an 8-week study period with three data series: Placebo, Trintellix 10 mg, and Trintellix 20 mg. The graph tracks measurements across eight weekly study visits, illustrating differential effects of placebo and two Trintellix doses over time.*
FDA Label Image

Figure 5 (Trintellix 06)

Figure 5 (Trintellix 06)
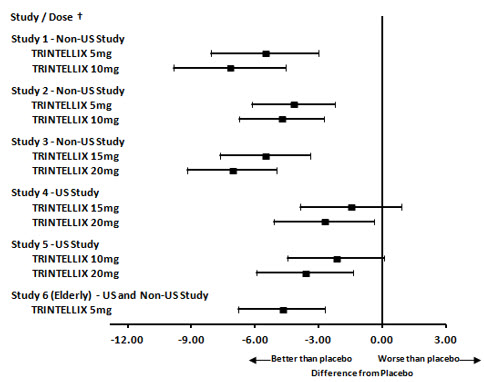
A forest plot chart illustrating the difference from placebo for various doses of Trintellix (vortioxetine) across multiple non-US and US clinical studies, including studies in elderly populations. The horizontal axis represents the difference from placebo, with markers and confidence intervals for doses ranging from 5 mg to 20 mg, indicating whether treatment outcomes were better or worse than placebo.*
FDA Label Image

Figure 6 (Trintellix 07)

Figure 6 (Trintellix 07)
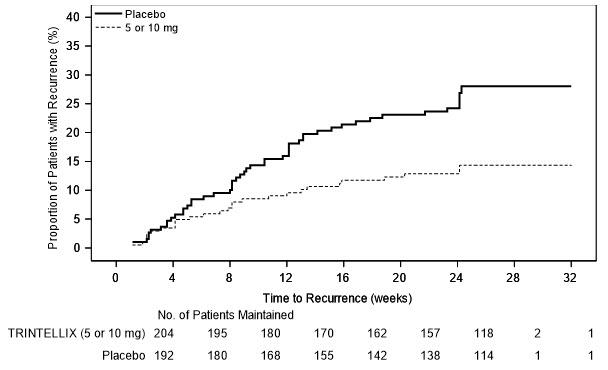
Line graph comparing the proportion of patients with recurrence over time (weeks) between placebo and Trintellix (5 or 10 mg) groups. The x-axis shows time to recurrence in weeks up to 32 weeks, and the y-axis shows the proportion of patients with recurrence as a percentage. A table below lists the number of patients maintained at various time points for each group.*
FDA Label Image

Figure 7 (Trintellix 08)

Figure 7 (Trintellix 08)
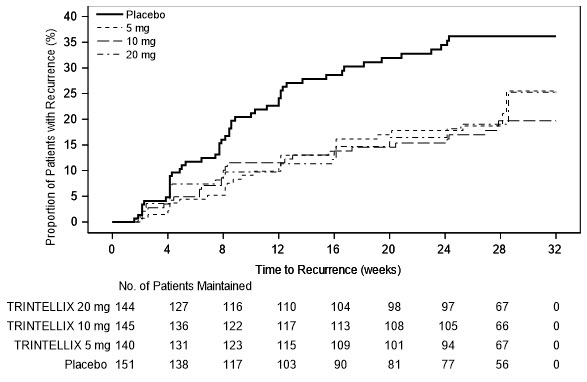
A line graph showing the proportion of patients with recurrence (%) over time in weeks for Trintellix (vortioxetine) at 5 mg, 10 mg, 20 mg doses compared to placebo. The x-axis represents time to recurrence (weeks), and the y-axis represents proportion of patients with recurrence (%). Lines illustrate recurrence rates for placebo and three doses of Trintellix. Below the graph, a table lists the number of patients maintained at different weeks for each group.*
FDA Label Image

Figure 8 (Trintellix 09)

Figure 8 (Trintellix 09)
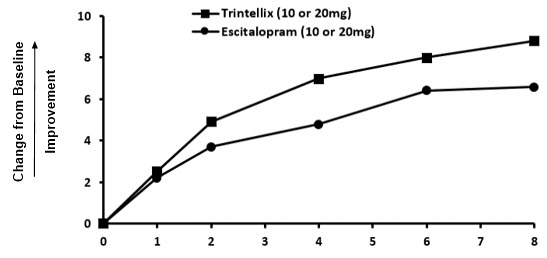
A line graph comparing improvement from baseline over 8 weeks between Trintellix (10 or 20 mg) and Escitalopram (10 or 20 mg). The vertical axis shows change from baseline, and the horizontal axis represents weeks. Trintellix shows greater improvement compared to Escitalopram across the timeframe.*
FDA Label Image

Figure 9 (Trintellix 10)

Figure 9 (Trintellix 10)
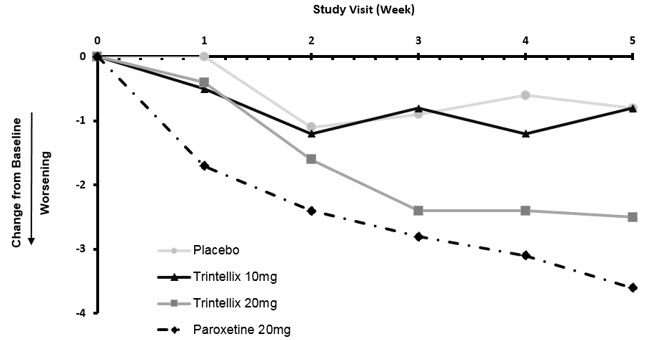
A line graph showing change from baseline in a study over a 5-week period. The x-axis represents study visit weeks 0 to 5, and the y-axis shows change from baseline with negative values indicating worsening. Four different treatments are plotted: placebo, Trintellix 10 mg, Trintellix 20 mg, and paroxetine 20 mg, each represented by distinct line styles and markers.*

* About these descriptions: Image descriptions on this page are generated by automated AI analysis of the product label images from the manufacturer's FDA label submission (SPL). They are provided for reference only and may contain errors or omissions. Always rely on the printed label itself and the official FDA labeling, and consult a pharmacist or healthcare professional with any questions about this product.