Lacosamide Tablet, Film Coated
Product Images NDC 70518-4503

5 FDA label images from Remedyrepack Inc. · Packaging, Regulatory Labels, and Product Appearance

Product Visual Gallery

This gallery contains 5 technical images submitted to the FDA as part of the official labeling for Lacosamide (NDC 70518-4503). Unlike standard consumer photos, these assets often include clinical data figures, molecular chemical structures, and official manufacturer packaging layouts.

As provided by Remedyrepack Inc., these visuals offer a comprehensive scientific overview of the product's physical and chemical identity, aiding pharmacists and researchers in product verification and study.

FDA Label Image

Structure (Lacosamide Str)

Structure (Lacosamide Str)
Chemical structure diagram of lacosamide, the active ingredient in Lacosamide tablets. The structure shows the molecular arrangement including acetamide, amide, methyl ester, and phenyl groups.*
FDA Label Image

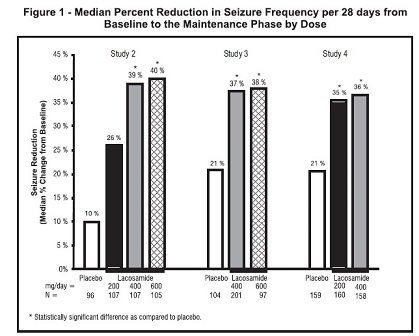
Figure1 (Lacosamide Figure 1)

Figure1 (Lacosamide Figure 1)
A bar chart titled 'Median Percent Reduction in Seizure Frequency per 28 days from Baseline to the Maintenance Phase by Dose.' The chart compares seizure frequency reduction percentages between placebo and various doses of lacosamide (200, 400, 600 mg/day) across four studies. The vertical axis shows percentage reduction from 0% to 45%, with labeled bars indicating values for placebo and lacosamide groups in each study, highlighting statistically significant differences.*
FDA Label Image

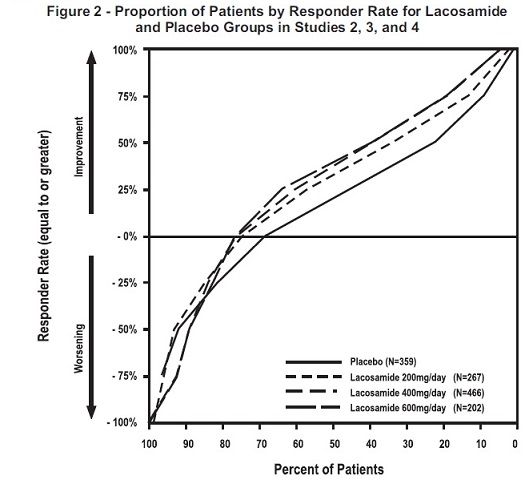
Figure2 (Lacosamide Figure 2)

Figure2 (Lacosamide Figure 2)
A line graph showing the proportion of patients by responder rate for Lacosamide and placebo groups across Studies 2, 3, and 4. The x-axis represents the percent of patients from 100% to 0%, and the y-axis shows responder rate from -100% (worsening) to 100% (improvement). Four lines compare placebo and three dosages of Lacosamide (200 mg/day, 400 mg/day, 600 mg/day).*
FDA Label Image

Figure 3 (Lacosamide Figure3)

Figure 3 (Lacosamide Figure3)
A Kaplan-Meier survival curve comparing the proportion of patients over time between those treated with Lacosamide and placebo. The graph features two lines representing the patient groups, with number at risk indicated below for each time point. Statistical data including p-value, hazard ratio, and confidence interval are displayed on the plot.*
FDA Label Image

Mm1 (Lacosamide 50mg 70518 4503 00)

* About these descriptions: Image descriptions on this page are generated by automated AI analysis of the product label images from the manufacturer's FDA label submission (SPL). They are provided for reference only and may contain errors or omissions. Always rely on the printed label itself and the official FDA labeling, and consult a pharmacist or healthcare professional with any questions about this product.