Lacosamide Tablet, Film Coated
Product Images NDC 70518-4504

View Photos of Packaging, Regulatory Labels, and Product Appearance

Product Visual Gallery

This gallery contains 5 technical images submitted to the FDA as part of the official labeling for Lacosamide (NDC 70518-4504). Unlike standard consumer photos, these assets often include clinical data figures, molecular chemical structures, and official manufacturer packaging layouts.

As provided by Remedyrepack Inc., these visuals offer a comprehensive scientific overview of the product's physical and chemical identity, aiding pharmacists and researchers in product verification and study.

FDA Label Image

Remedy_label (Remedy Label)

Remedy_label (Remedy Label)
Lacosamide Tablet C-V 200 mg film-coated oral tablets, quantity of 30. The label includes NDC 70518-4504-00 and states the tablets are oval, blue, marked L426. Manufactured by Alembic Pharma, Bridgewater, NJ, and repackaged by RemedyRepack Inc., Indiana, PA. Storage instructions and warnings to keep out of reach of children are also visible.*
FDA Label Image

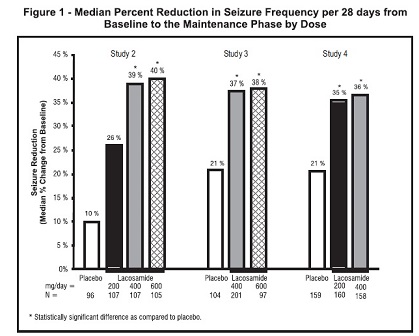
Figure1 (Lacosamide Figure 1)

Figure1 (Lacosamide Figure 1)
A bar chart titled 'Median Percent Reduction in Seizure Frequency per 28 days from Baseline to the Maintenance Phase by Dose,' showing seizure frequency reduction percentages for placebo and lacosamide doses across Studies 2, 3, and 4. The chart compares percent reductions for placebo with lacosamide 200 mg, 400 mg, and 600 mg, with lacosamide groups showing higher reductions than placebo in all studies.*
FDA Label Image

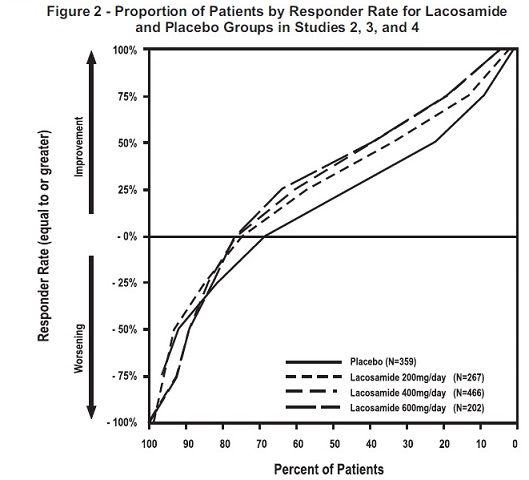
Figure2 (Lacosamide Figure 2)

Figure2 (Lacosamide Figure 2)
A line graph titled 'Proportion of Patients by Responder Rate for Lacosamide and Placebo Groups in Studies 2, 3, and 4.' The vertical axis represents responder rate from -100% (worsening) to 100% (improvement). The horizontal axis shows percent of patients ranging from 0 to 100%. Four lines compare placebo (N=359) and lacosamide doses 200 mg/day (N=267), 400 mg/day (N=466), and 600 mg/day (N=202). The graph illustrates responder rate distributions across these groups.*
FDA Label Image

Figure 3 (Lacosamide Figure3)

Figure 3 (Lacosamide Figure3)
A survival curve chart comparing the proportion of patients over time between two groups: Lacosamide and Placebo. The x-axis represents time, the y-axis represents the proportion of patients, and lines depict differences in outcomes between the groups, with risk numbers at various time points provided below the chart.*
FDA Label Image

Structure (Lacosamide Str)

Structure (Lacosamide Str)
Chemical structure of lacosamide, showing its molecular framework with an acetyl group, an amide linkage, and a benzyl-substituted side chain.*

* About these descriptions: Image descriptions on this page are generated by automated AI analysis of the product label images from the manufacturer's FDA label submission (SPL). They are provided for reference only and may contain errors or omissions. Always rely on the printed label itself and the official FDA labeling, and consult a pharmacist or healthcare professional with any questions about this product.