Guanfacine Tablet, Extended Release
Product Images NDC 70518-4539

View Photos of Packaging, Regulatory Labels, and Product Appearance

Product Visual Gallery

This gallery contains 6 technical images submitted to the FDA as part of the official labeling for Guanfacine (NDC 70518-4539). Unlike standard consumer photos, these assets often include clinical data figures, molecular chemical structures, and official manufacturer packaging layouts.

As provided by Remedyrepack Inc., these visuals offer a comprehensive scientific overview of the product's physical and chemical identity, aiding pharmacists and researchers in product verification and study.

FDA Label Image

Remedy_label (Remedy Label)
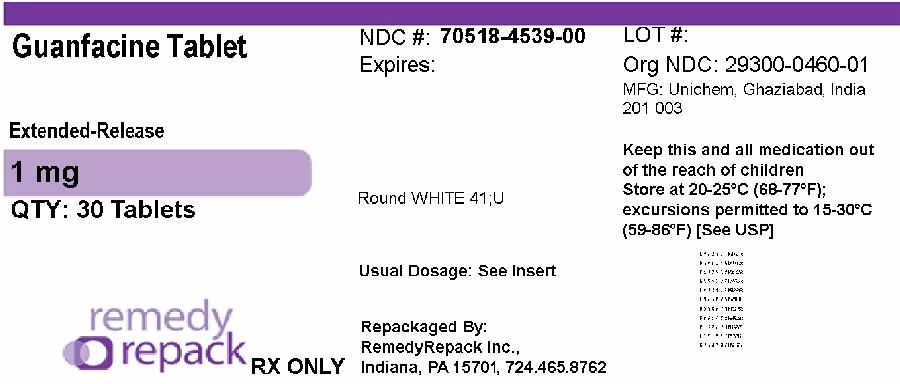
Remedy_label (Remedy Label)
Guanfacine extended-release tablets, 1 mg strength, packaged in a quantity of 30 tablets. The label shows the NDC number 70518-4539-00 and indicates the product is repackaged by RemedyRepack Inc., Indiana, PA. Storage instructions and manufacturer details (Unichem, Ghaziabad, India) are also included.*
FDA Label Image

Figure 01 (Bc9cc5d2 E098 41da Ae90 0944715d6b92 01)

Figure 01 (Bc9cc5d2 E098 41da Ae90 0944715d6b92 01)
Chemical structure of guanfacine hydrochloride showing its molecular composition with a chlorinated phenyl group, amide, and guanidine functional groups.*
FDA Label Image

Image (Bc9cc5d2 E098 41da Ae90 0944715d6b92 02)

Image (Bc9cc5d2 E098 41da Ae90 0944715d6b92 02)
A pharmacokinetic line graph comparing plasma concentrations of Guanfacine over 24 hours after administering two formulations: Guanfacine Extended-Release Tablets 1 mg once daily and Tenex 1 mg once daily. The x-axis represents time in hours, and the y-axis shows Guanfacine plasma concentration in ng/mL, illustrating the drug concentration profiles over time for each product.*
FDA Label Image

Figure 2 (Bc9cc5d2 E098 41da Ae90 0944715d6b92 03)

Figure 2 (Bc9cc5d2 E098 41da Ae90 0944715d6b92 03)
A fold change graph illustrating the impact of various CYP3A4/5 inhibitors and inducers, as well as other substances, on pharmacokinetic parameters (Cmax and AUC). The graph includes data from human studies and computer simulations, showing fold change values with 90% confidence intervals for Ketoconazole, Fluconazole, Rifampin, Efavirenz, Oral Methylphenidate, and Lisdexamfetamine Dimesylate.*
FDA Label Image

Figure 3 (Bc9cc5d2 E098 41da Ae90 0944715d6b92 04)

Figure 3 (Bc9cc5d2 E098 41da Ae90 0944715d6b92 04)
A pharmacokinetic chart showing fold change and 90% confidence intervals for Cmax and AUC of two interacting drugs, Oral Methylphenidate and Lisdexamfetamine Dimesylate, relative to a reference. The x-axis measures change relative to reference from 0.0 to 2.0.*
FDA Label Image

Figure-04 (Bc9cc5d2 E098 41da Ae90 0944715d6b92 05)

Figure-04 (Bc9cc5d2 E098 41da Ae90 0944715d6b92 05)
A line chart showing time to treatment failure in days on the x-axis versus treatment failure percentage on the y-axis. Two lines represent Placebo and SPF503 groups, illustrating comparative treatment failure rates over time.*

* About these descriptions: Image descriptions on this page are generated by automated AI analysis of the product label images from the manufacturer's FDA label submission (SPL). They are provided for reference only and may contain errors or omissions. Always rely on the printed label itself and the official FDA labeling, and consult a pharmacist or healthcare professional with any questions about this product.