Trospium Chloride Tablet, Film Coated
Product Images NDC 70518-4593

View Photos of Packaging, Regulatory Labels, and Product Appearance

Product Visual Gallery

This gallery contains 8 technical images submitted to the FDA as part of the official labeling for Trospium Chloride (NDC 70518-4593). Unlike standard consumer photos, these assets often include clinical data figures, molecular chemical structures, and official manufacturer packaging layouts.

As provided by Remedyrepack Inc., these visuals offer a comprehensive scientific overview of the product's physical and chemical identity, aiding pharmacists and researchers in product verification and study.

FDA Label Image

Remedy_label (Remedy Label)
Remedy_label (Remedy Label)
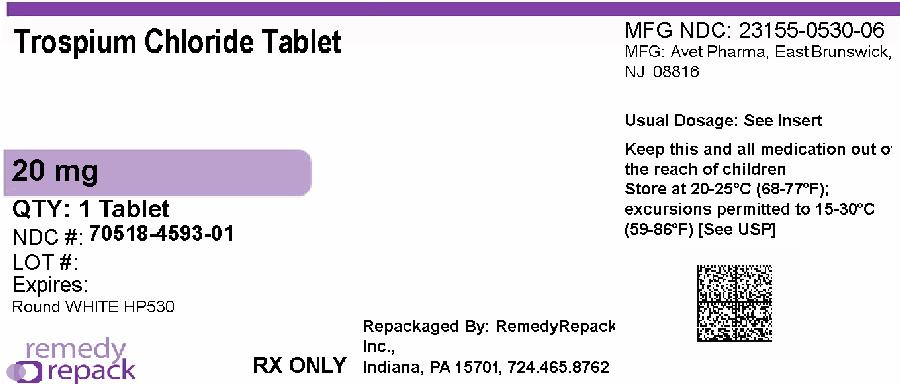
Label for Trospium Chloride Tablet 20 mg, film-coated, with a quantity of 1 tablet per package. Manufactured by Avet Pharma, East Brunswick, NJ, and repackaged by RemedyRepack Inc., Indiana, PA. Directions note usual dosage see insert, with storage instructions and warnings regarding keeping out of reach of children.*
FDA Label Image

Mm1 (Trospium Chloride 20mg 70518 4593 00)

Mm1 (Trospium Chloride 20mg 70518 4593 00)
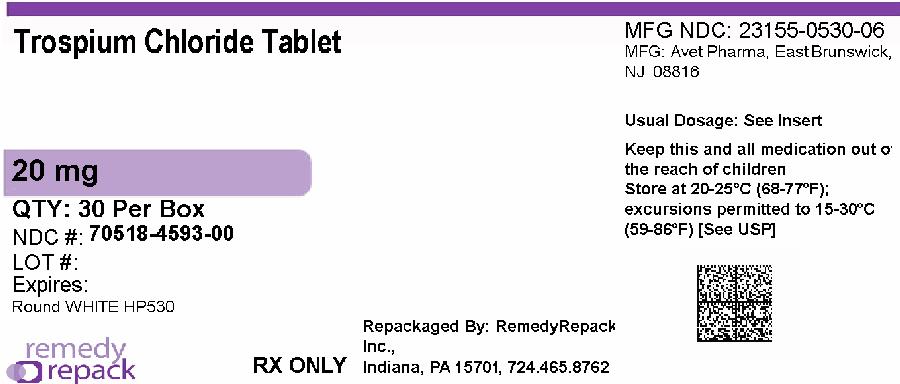
Trospium Chloride 20 mg film-coated tablets in a box of 30, labeled by RemedyRepack Inc. The label includes the NDC number 70518-4593-00 and notes repackaging by RemedyRepack in Indiana, PA. Storage instructions and manufacturer information for Avet Pharma, East Brunswick, NJ, are also visible.*
FDA Label Image

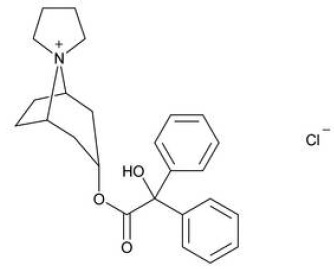
Structure (Bf13cc11 83d9 43c1 9604 005aaba70123 01)

Structure (Bf13cc11 83d9 43c1 9604 005aaba70123 01)
Chemical structure of Trospium Chloride showing the molecular arrangement including the tropane ring, ester linkage, and two phenyl groups, alongside the chloride anion (Cl-).*
FDA Label Image

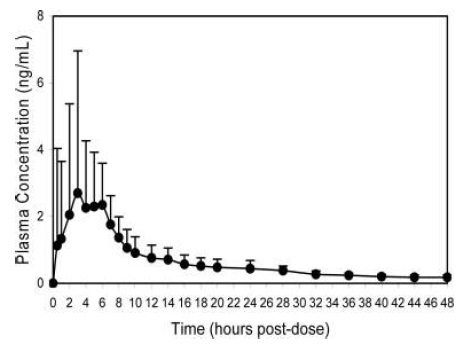
Figure 1 (Bf13cc11 83d9 43c1 9604 005aaba70123 02)

Figure 1 (Bf13cc11 83d9 43c1 9604 005aaba70123 02)
A pharmacokinetic curve showing plasma concentration (ng/mL) over time (hours post-dose) up to 48 hours. Data points with error bars illustrate how plasma concentration changes following administration of Trospium Chloride 20 mg oral tablet.*
FDA Label Image

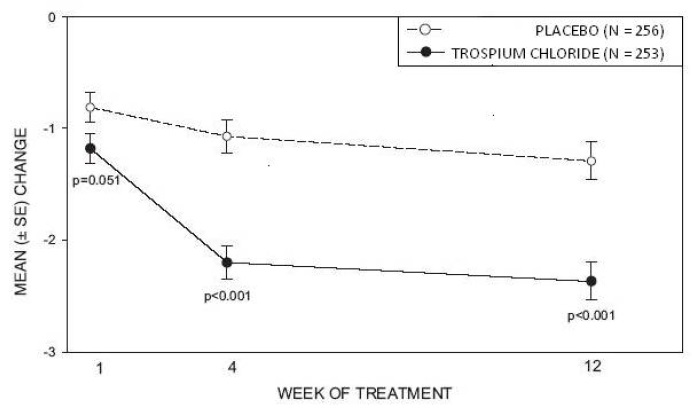
Figure 2 (Bf13cc11 83d9 43c1 9604 005aaba70123 03)

Figure 2 (Bf13cc11 83d9 43c1 9604 005aaba70123 03)
A line graph depicting mean changes over weeks of treatment comparing placebo and Trospium Chloride groups. The x-axis represents weeks 1, 4, and 12 of treatment. The y-axis shows mean change values with standard error bars. Trospium Chloride shows a greater decrease over time compared to placebo, with significance levels noted at each time point.*
FDA Label Image

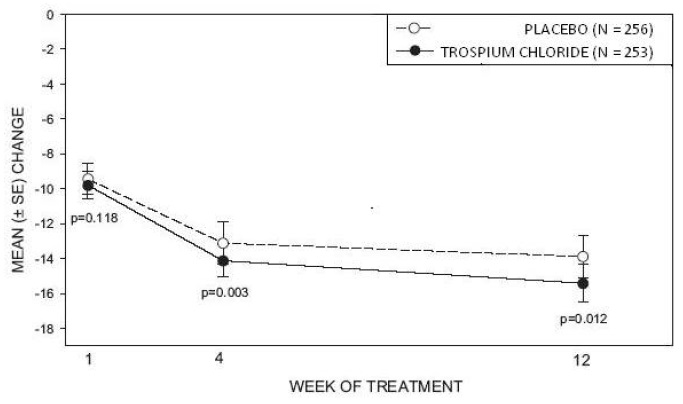
Figure 3 (Bf13cc11 83d9 43c1 9604 005aaba70123 04)

Figure 3 (Bf13cc11 83d9 43c1 9604 005aaba70123 04)
A line graph comparing mean changes over treatment weeks between placebo and Trospium Chloride groups. The x-axis shows weeks of treatment (1, 4, 12) and the y-axis shows mean change with standard error bars. Trospium Chloride is represented by a solid line with filled circles, placebo by a dashed line with open circles. P-values at weeks 1, 4, and 12 are noted on the graph.*
FDA Label Image

Figure 4 (Bf13cc11 83d9 43c1 9604 005aaba70123 05)

Figure 4 (Bf13cc11 83d9 43c1 9604 005aaba70123 05)
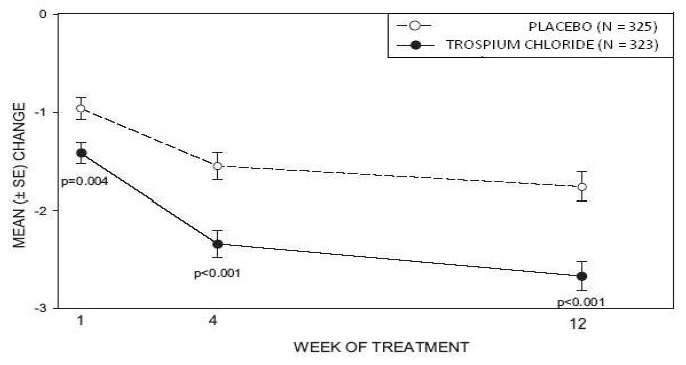
A line graph comparing mean change (± standard error) over weeks of treatment between placebo (N=325) and Trospium Chloride (N=323). The x-axis represents weeks of treatment at 1, 4, and 12 weeks. The y-axis shows mean change, with data points demonstrating greater decrease over time for Trospium Chloride versus placebo, including p-values at each time point (p=0.004, p<0.001, and p<0.001).*
FDA Label Image

Figure 5 (Bf13cc11 83d9 43c1 9604 005aaba70123 06)

Figure 5 (Bf13cc11 83d9 43c1 9604 005aaba70123 06)
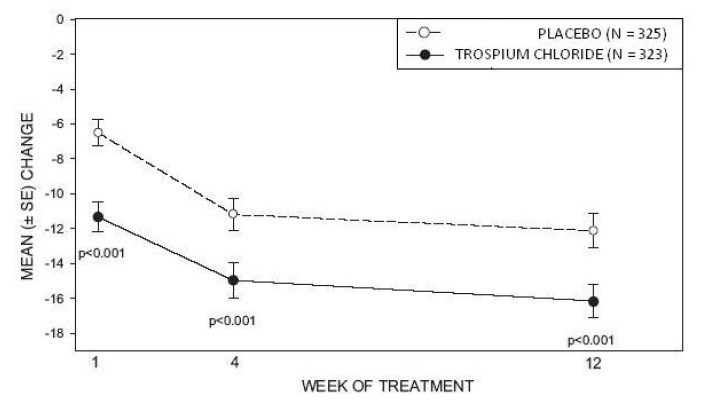
A line graph comparing mean (± SE) change over a 12-week treatment period between Trospium Chloride and placebo groups. The x-axis represents weeks of treatment (1, 4, 12), and the y-axis shows mean changes, with Trospium Chloride displaying a greater reduction compared to placebo. Both groups include sample sizes (323 for Trospium Chloride, 325 for placebo) and significant p-values (p<0.001) noted at each time point.*

* About these descriptions: Image descriptions on this page are generated by automated AI analysis of the product label images from the manufacturer's FDA label submission (SPL). They are provided for reference only and may contain errors or omissions. Always rely on the printed label itself and the official FDA labeling, and consult a pharmacist or healthcare professional with any questions about this product.