Mirabegron Tablet, Film Coated, Extended Release
Product Images NDC 70518-4665

View Photos of Packaging, Regulatory Labels, and Product Appearance

Product Visual Gallery

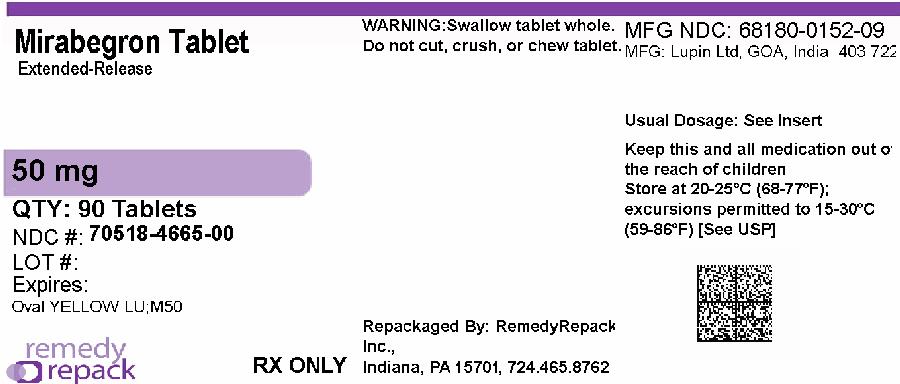
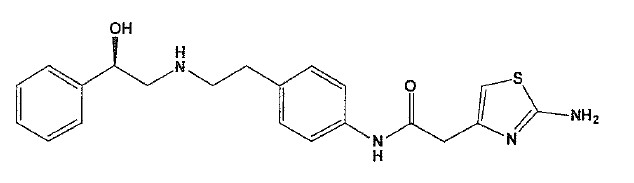
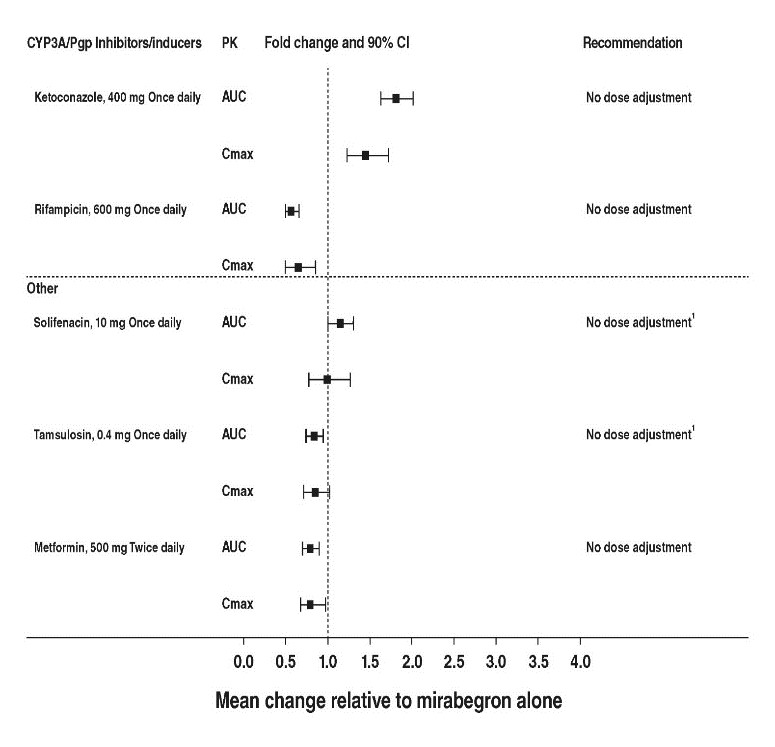
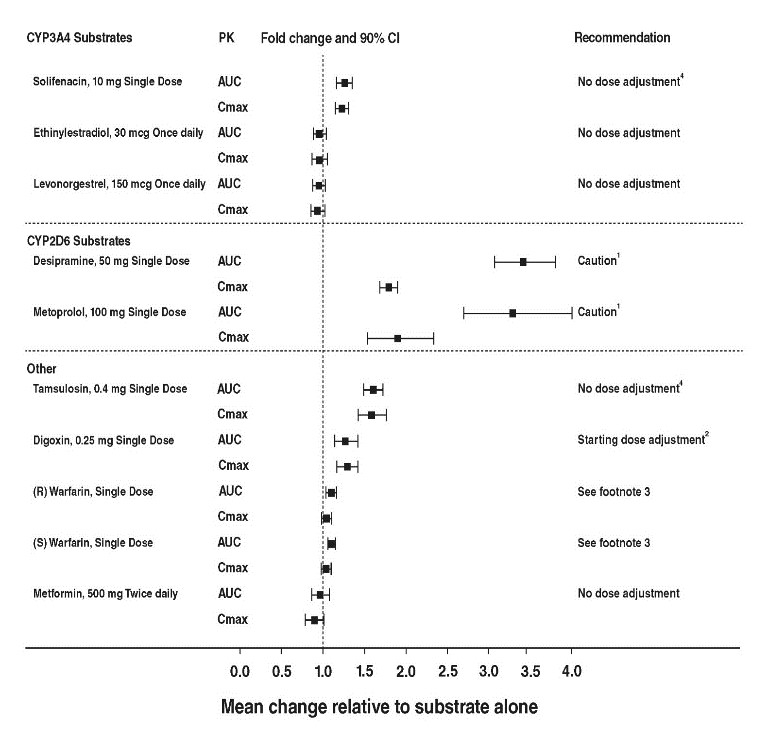
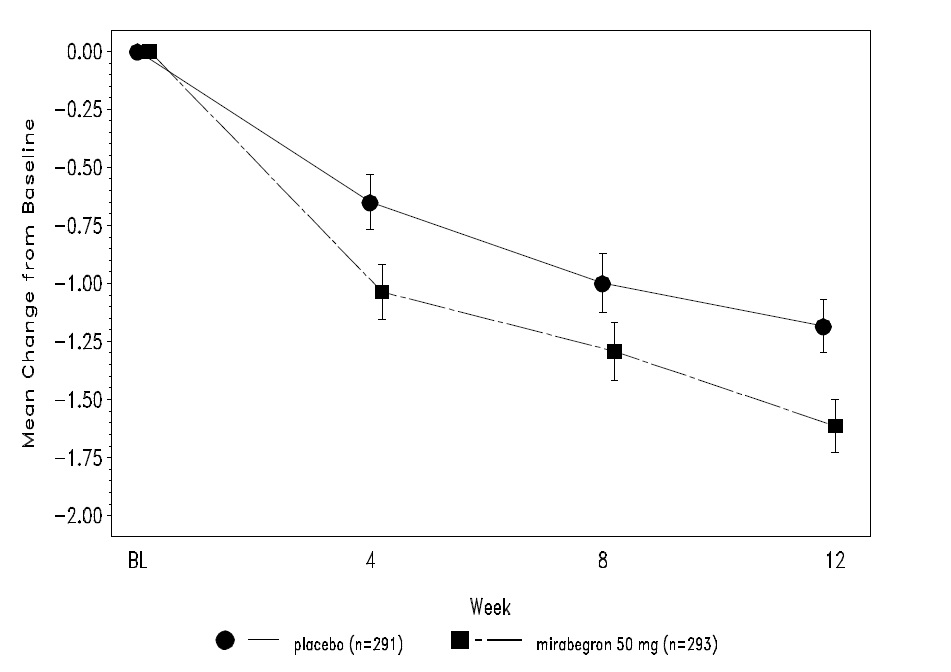
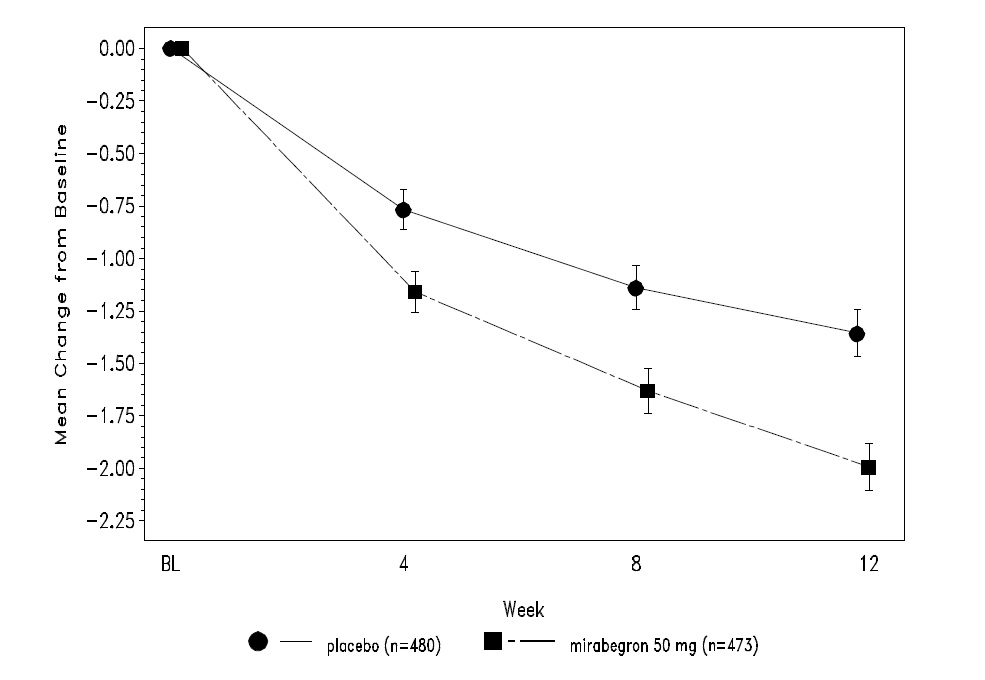
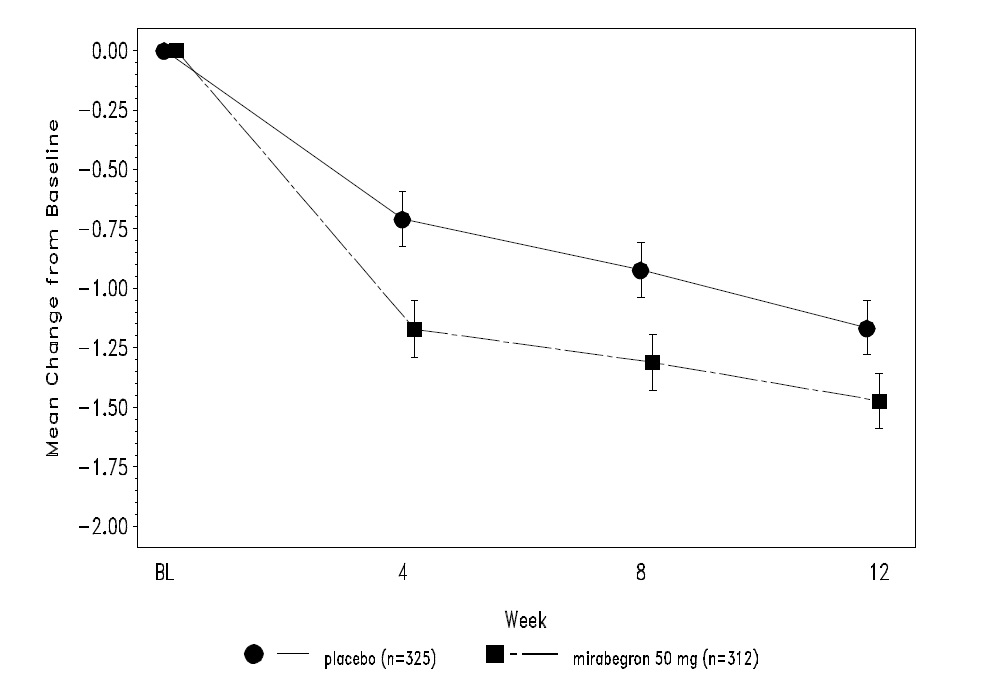
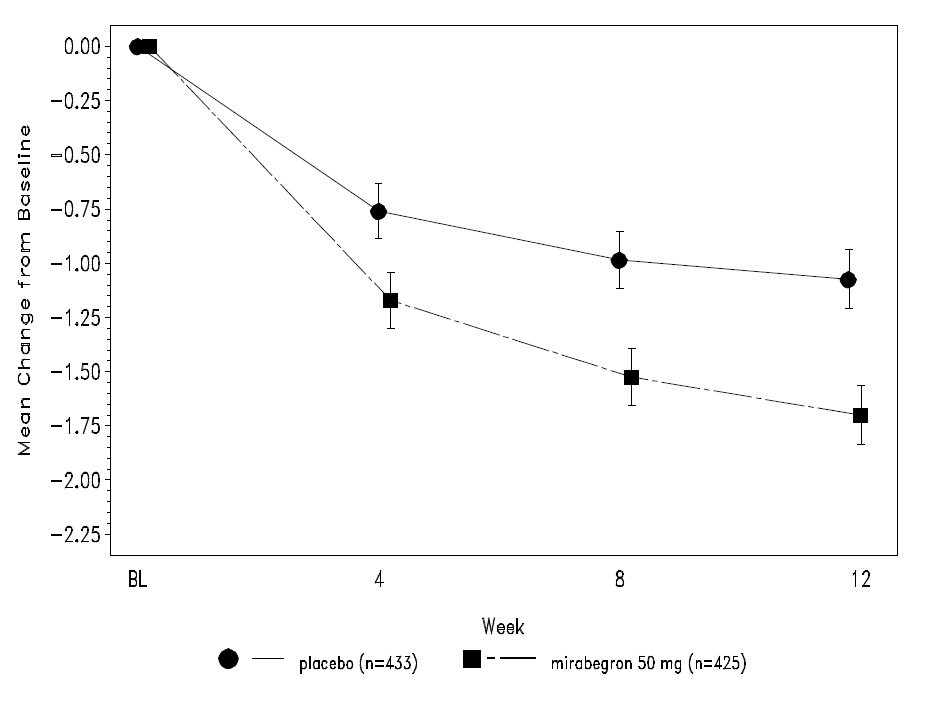
This gallery contains 12 technical images submitted to the FDA as part of the official labeling for Mirabegron (NDC 70518-4665). Unlike standard consumer photos, these assets often include clinical data figures, molecular chemical structures, and official manufacturer packaging layouts.

As provided by Remedyrepack Inc., these visuals offer a comprehensive scientific overview of the product's physical and chemical identity, aiding pharmacists and researchers in product verification and study.

FDA Label Image

Image (6e53669c 9083 47ad 9bde 3a936703073e 119 1)

FDA Label Image

Image (6e53669c 9083 47ad 9bde 3a936703073e 135 1)

FDA Label Image

Remedy_label (Remedy Label)

Remedy_label (Remedy Label)
This is a description of Mirabegron Tablet, an extended-release medication with a dosage of 50 mg. The tablets should not be cut, crushed, or chewed but swallowed whole. It is important to keep the medication out of reach of children and store it at a temperature between 20-25°C (68-77°F) with excursions up to 15-30°C (59-86°F) permitted. The NDC number is 70618-4665-00, and the QTY is 90 tablets in an oval yellow color. The medication was repackaged by RemedyRepack Inc. in Indiana, PA. Dosage instructions are available in the insert provided.*
FDA Label Image

Structure (Mirabegron)

FDA Label Image

Fig 1 (B26f08e4 Dfe4 4a0f B6b5 E9abb495e415 02)

Fig 1 (B26f08e4 Dfe4 4a0f B6b5 E9abb495e415 02)
This text provides information on the effects of CYP3A/Pgp inhibitors and inducers on the pharmacokinetics of different drugs. It includes data on the fold change and 90% confidence interval (CI) for drugs such as ketoconazole, rifampicin, solifenacin, tamsulosin, and metformin. The text suggests whether dose adjustments are needed for these drugs when co-administered with the inhibitors or inducers. The data also presents the mean change relative to mirabegron when used alone.*
FDA Label Image

Fig 2 (B26f08e4 Dfe4 4a0f B6b5 E9abb495e415 03)

Fig 2 (B26f08e4 Dfe4 4a0f B6b5 E9abb495e415 03)
This text appears to be providing information on fold change and 90% confidence intervals for CYP3M and CYP2D6 substrates like solifenacin, ethinylestraciol, levonorgestrel, desipramine, metoprolol, tamsulosin, digoxin, Warfarin, and metformin, including details on AUC, Cmax, and dose adjustments.*
FDA Label Image

Figure 3 (B26f08e4 Dfe4 4a0f B6b5 E9abb495e415 04)

Figure 3 (B26f08e4 Dfe4 4a0f B6b5 E9abb495e415 04)
This text appears to show numerical values representing changes from a baseline measurement, with values starting from 0.00 and decreasing in increments of 0.25 until reaching -2.00. The data seems to be related to a comparison between a placebo group (n=291) and a group receiving mirabegron 50 mg (n=293) over a duration of 12 weeks. The "Mean Change from Baseline" is noted in the list.*
FDA Label Image

Figure 4 (B26f08e4 Dfe4 4a0f B6b5 E9abb495e415 05)

Figure 4 (B26f08e4 Dfe4 4a0f B6b5 E9abb495e415 05)
This text provides a list of data points for measurements at different intervals, mean change from baseline, and a comparison between placebo and mirabegron 50 mg treatment groups. The values are numerical and refer to a research study or clinical trial.*
FDA Label Image

Figure 5 (B26f08e4 Dfe4 4a0f B6b5 E9abb495e415 06)

Figure 5 (B26f08e4 Dfe4 4a0f B6b5 E9abb495e415 06)
This text provides a series of numerical values denoting changes from baseline, with some values showing a decrease over time. It also mentions a comparison between a placebo group and a group taking mirabegron 50 mg. The data seems to be related to a study or experiment that involved measuring changes in a certain variable over a period of time in two different groups of participants.*
FDA Label Image

Figure 6 (B26f08e4 Dfe4 4a0f B6b5 E9abb495e415 07)

FDA Label Image

Figure 7 (B26f08e4 Dfe4 4a0f B6b5 E9abb495e415 08)

Figure 7 (B26f08e4 Dfe4 4a0f B6b5 E9abb495e415 08)
This text appears to be a data table showing the mean changes from baseline at different time points for different treatment groups (placebo, mirabegron 25 mg, and mirabegron 50 mg). The values provided indicate changes in increments of 0.25 from 0.00 to -2.00. The table also includes a header for week numbers and sample size for each treatment group. The data suggests a comparison of the effects of mirabegron at different dosages compared to a placebo over multiple weeks.*
FDA Label Image

Figure 8 (B26f08e4 Dfe4 4a0f B6b5 E9abb495e415 09)

Figure 8 (B26f08e4 Dfe4 4a0f B6b5 E9abb495e415 09)
This description displays a comparison of mean change from baseline for three different treatment groups: placebo (n=415), mirabegron 25 mg (n=410), and mirabegron 50 mg (n=426) over the course of 12 weeks. The values range from 0.00 to -2.25, with intermediate values mentioned in the text. There are also additional characters and symbols present in the data listing.*

* These product label images have been analyzed using experimental machine learning. Please verify findings with the primary label text.