Guanfacine Tablet, Extended Release
Product Images NDC 70518-4675

View Photos of Packaging, Regulatory Labels, and Product Appearance

Product Visual Gallery

This gallery contains 6 technical images submitted to the FDA as part of the official labeling for Guanfacine (NDC 70518-4675). Unlike standard consumer photos, these assets often include clinical data figures, molecular chemical structures, and official manufacturer packaging layouts.

As provided by Remedyrepack Inc., these visuals offer a comprehensive scientific overview of the product's physical and chemical identity, aiding pharmacists and researchers in product verification and study.

FDA Label Image

Remedy_label (Remedy Label)
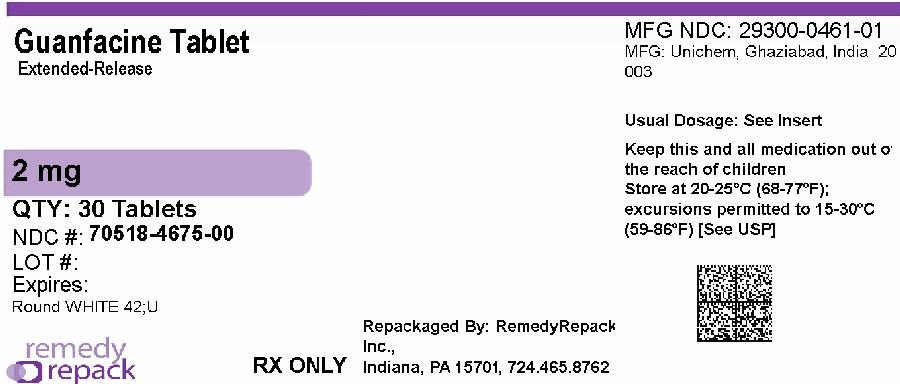
Remedy_label (Remedy Label)
Label for Guanfacine Tablet extended-release 2 mg, oral tablets. The label indicates a quantity of 30 tablets and identifies RemedyRepack Inc. as the repackager, located in Indiana, PA. Storage and dosage instructions are partially visible along with the NDC number 70518-4675-00.*
FDA Label Image

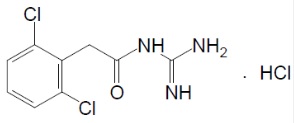
Figure 01 (Bc9cc5d2 E098 41da Ae90 0944715d6b92 01)

Figure 01 (Bc9cc5d2 E098 41da Ae90 0944715d6b92 01)
Chemical structure of Guanfacine hydrochloride displayed as a molecular diagram showing the arrangement of atoms including chlorine (Cl), nitrogen (NH2), and an amide group, consistent with Guanfacine HCl.*
FDA Label Image

Image (Bc9cc5d2 E098 41da Ae90 0944715d6b92 02)

Image (Bc9cc5d2 E098 41da Ae90 0944715d6b92 02)
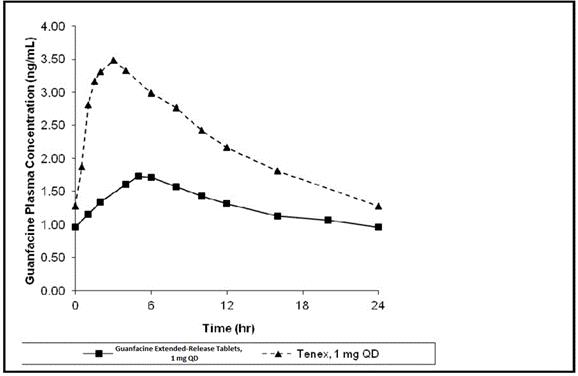
A pharmacokinetic line graph comparing plasma concentration over 24 hours for Guanfacine Extended-Release Tablets 1 mg QD and Tenex 1 mg QD. The y-axis shows Guanfacine plasma concentration in ng/mL and the x-axis shows time in hours, with the Tenex curve peaking higher and earlier than the Guanfacine extended-release curve.*
FDA Label Image

Figure 2 (Bc9cc5d2 E098 41da Ae90 0944715d6b92 03)

Figure 2 (Bc9cc5d2 E098 41da Ae90 0944715d6b92 03)
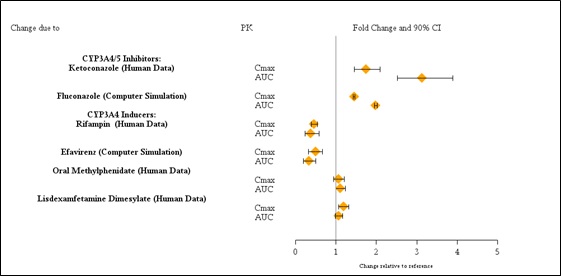
A forest plot chart shows fold change and 90% confidence intervals for various CYP3A4/5 inhibitors and inducers impacting pharmacokinetics (Cmax and AUC) of guanfacine, including ketoconazole, fluconazole, rifampin, efavirenz, oral methylphenidate, and lisdexamfetamine dimesylate. Human data and computer simulation sources are noted.*
FDA Label Image

Figure 3 (Bc9cc5d2 E098 41da Ae90 0944715d6b92 04)

Figure 3 (Bc9cc5d2 E098 41da Ae90 0944715d6b92 04)
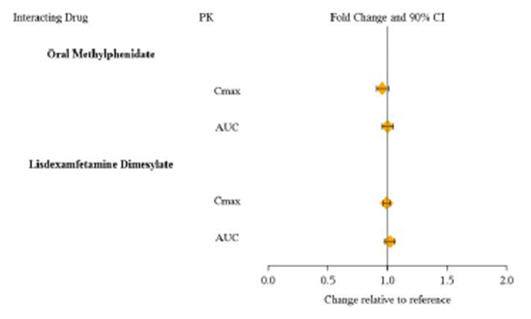
A plot showing fold change and 90% confidence intervals for pharmacokinetic parameters Cmax and AUC of interacting drugs Oral Methylphenidate and Lisdexamfetamine Dimesylate relative to reference values. The x-axis represents change relative to reference from 0.0 to 2.0, with data points near 1.0 indicating minimal change.*
FDA Label Image

Figure-04 (Bc9cc5d2 E098 41da Ae90 0944715d6b92 05)

Figure-04 (Bc9cc5d2 E098 41da Ae90 0944715d6b92 05)
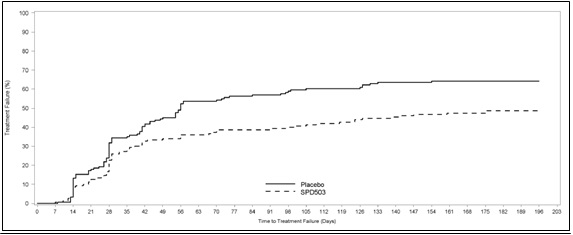
A line graph showing time to treatment failure in days on the x-axis and treatment failure percentage on the y-axis, comparing two groups labeled Placebo and SPD503. The Placebo group shows a higher cumulative percentage of treatment failure over time than the SPD503 group.*

* About these descriptions: Image descriptions on this page are generated by automated AI analysis of the product label images from the manufacturer's FDA label submission (SPL). They are provided for reference only and may contain errors or omissions. Always rely on the printed label itself and the official FDA labeling, and consult a pharmacist or healthcare professional with any questions about this product.