Clopidogrel Bisulfate Tablet, Film Coated
Product Images NDC 70518-4680

View Photos of Packaging, Regulatory Labels, and Product Appearance

Product Visual Gallery

This gallery contains 10 technical images submitted to the FDA as part of the official labeling for Clopidogrel Bisulfate (NDC 70518-4680). Unlike standard consumer photos, these assets often include clinical data figures, molecular chemical structures, and official manufacturer packaging layouts.

As provided by Remedyrepack Inc., these visuals offer a comprehensive scientific overview of the product's physical and chemical identity, aiding pharmacists and researchers in product verification and study.

FDA Label Image

Remedy_label (Remedy Label)
Remedy_label (Remedy Label)
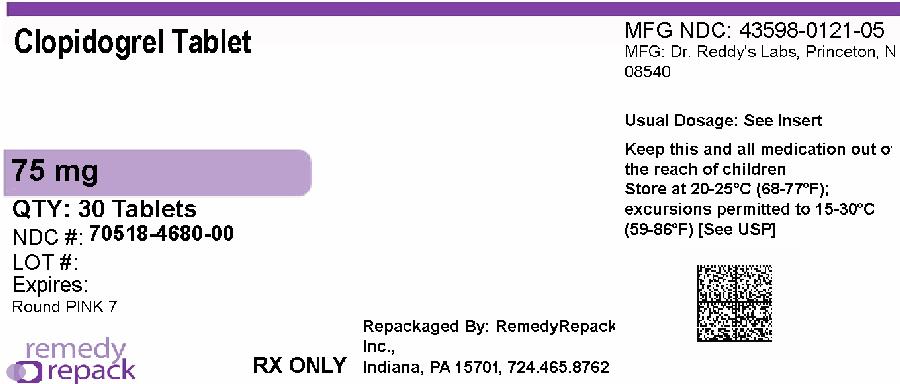
Label for Clopidogrel Tablet, 75 mg, film-coated, oral administration. The package contains 30 tablets. Labeler is RemedyRepack Inc., Indiana, PA. The label includes storage instructions, a QR code, and mentions original manufacturer Dr. Reddy's Labs, Princeton, NJ. Marked as RX only with the NDC 70518-4680-00.*
FDA Label Image

Figure1 (Figure1)

Figure1 (Figure1)
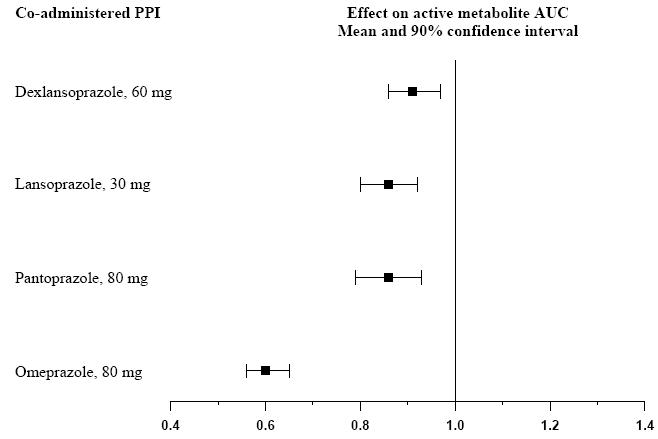
A horizontal bar chart showing the effect of co-administered proton pump inhibitors (PPIs) on the active metabolite area under the curve (AUC) of Clopidogrel bisulfate. The chart lists dexlansoprazole 60 mg, lansoprazole 30 mg, pantoprazole 80 mg, and omeprazole 80 mg, each with a mean effect and 90% confidence interval represented by black bars and error lines along a scale from 0.4 to 1.4.*
FDA Label Image

Figure2 (Figure2)

Figure2 (Figure2)
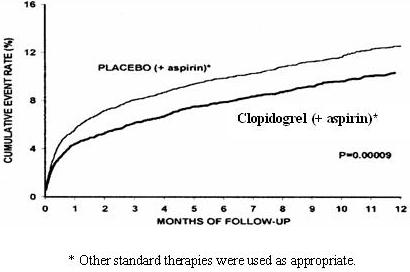
A line graph showing cumulative event rate (%) over 12 months of follow-up comparing Clopidogrel (+ aspirin) and Placebo (+ aspirin) groups. The graph indicates higher event rates in the placebo group at each time point, with a significant p-value of 0.00009. The note mentions that other standard therapies were used as appropriate.*
FDA Label Image

Figure3 (Figure3)

Figure3 (Figure3)
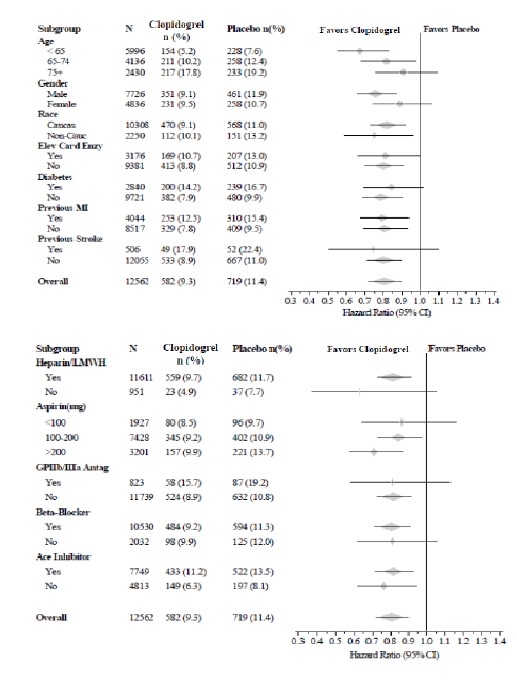
A forest plot chart showing subgroup analyses comparing Clopidogrel versus Placebo on hazard ratios with 95% confidence intervals. Subgroups include age, gender, race, elevated cardiac enzymes, diabetes, previous myocardial infarction, previous stroke, heparin/LMWH use, aspirin dosage, GP IIb/IIIa antagonist use, beta-blocker use, and ACE inhibitor use. The chart visualizes relative favors between Clopidogrel and Placebo treatments across these categories.*
FDA Label Image

Figure4 (Figure4)

Figure4 (Figure4)
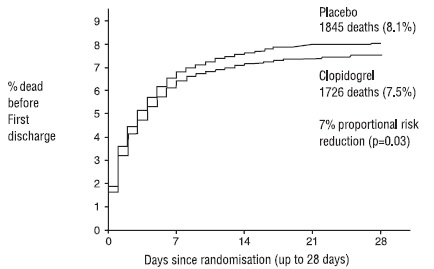
A line graph depicting the percentage of deaths before first discharge over 28 days since randomization, comparing Clopidogrel and placebo groups. The graph shows cumulative mortality with Clopidogrel associated with a 7% proportional risk reduction versus placebo, with annotated final death counts and corresponding percentages for each group.*
FDA Label Image

Figure5 (Figure5)

Figure5 (Figure5)
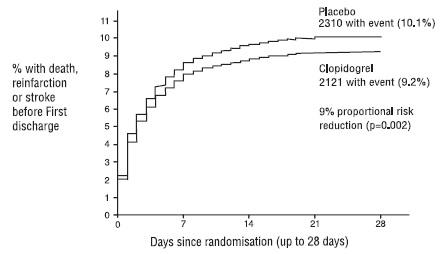
A Kaplan-Meier curve chart showing the percentage of patients with death, reinfarction, or stroke before first discharge over 28 days since randomization. Two lines compare outcomes for Placebo (10.1% event rate) and Clopidogrel (9.2% event rate), with an indicated 9% proportional risk reduction (p=0.002).*
FDA Label Image

Figure6 (Figure6)

Figure6 (Figure6)
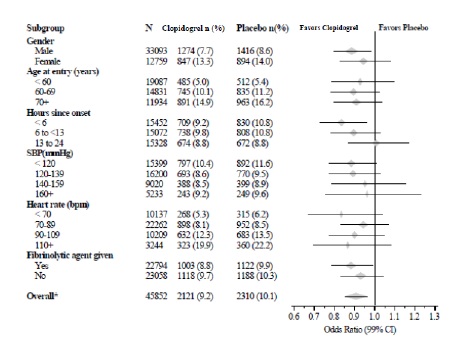
A forest plot chart showing odds ratios with 99% confidence intervals for Clopidogrel bisulfate versus placebo across various subgroups including gender, age at entry, hours since onset, systolic blood pressure, heart rate, and fibrinolytic agent use. The chart compares the favorability of Clopidogrel or placebo for each subgroup based on odds ratios plotted along a horizontal axis ranging approximately from 0.6 to 1.3.*
FDA Label Image

Figure7 (Figure7)

Figure7 (Figure7)
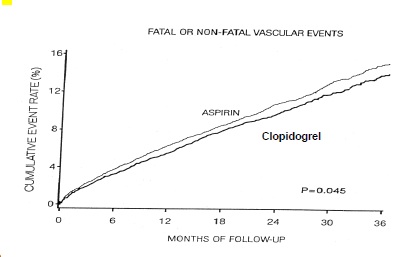
A line graph comparing cumulative event rates (%) of fatal or non-fatal vascular events over months of follow-up (0 to 36) between Clopidogrel and Aspirin. The graph shows separate curves for each drug with a p-value of 0.045 indicating statistical analysis.*
FDA Label Image

Figure8 (Figure8)

Figure8 (Figure8)
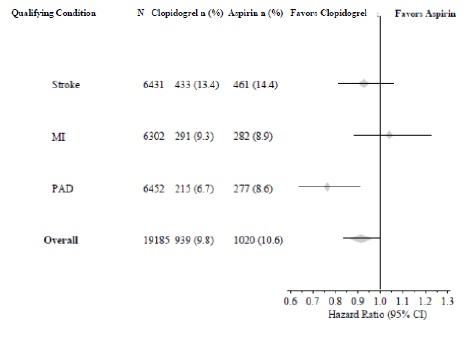
A forest plot chart showing hazard ratios with 95% confidence intervals comparing Clopidogrel versus Aspirin across qualifying conditions: Stroke, MI, PAD, and Overall. The horizontal axis displays hazard ratios ranging approximately from 0.6 to 1.3, indicating which treatment favors Clopidogrel or Aspirin.*
FDA Label Image

Structure (Structure)

Structure (Structure)
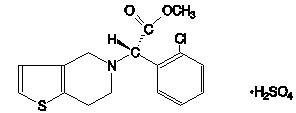
Chemical structure of Clopidogrel bisulfate, depicting the molecular arrangement including the bicyclic ring with a sulfur atom, methyl ester, chlorine-substituted phenyl ring, and associated hydrogen sulfate component.*

* About these descriptions: Image descriptions on this page are generated by automated AI analysis of the product label images from the manufacturer's FDA label submission (SPL). They are provided for reference only and may contain errors or omissions. Always rely on the printed label itself and the official FDA labeling, and consult a pharmacist or healthcare professional with any questions about this product.