Quetiapine Tablet, Extended Release
Product Images NDC 70518-4700

View Photos of Packaging, Regulatory Labels, and Product Appearance

Product Visual Gallery

This gallery contains 5 technical images submitted to the FDA as part of the official labeling for Quetiapine (NDC 70518-4700). Unlike standard consumer photos, these assets often include clinical data figures, molecular chemical structures, and official manufacturer packaging layouts.

As provided by Remedyrepack Inc., these visuals offer a comprehensive scientific overview of the product's physical and chemical identity, aiding pharmacists and researchers in product verification and study.

FDA Label Image

Remedy_label (Remedy Label)
Remedy_label (Remedy Label)
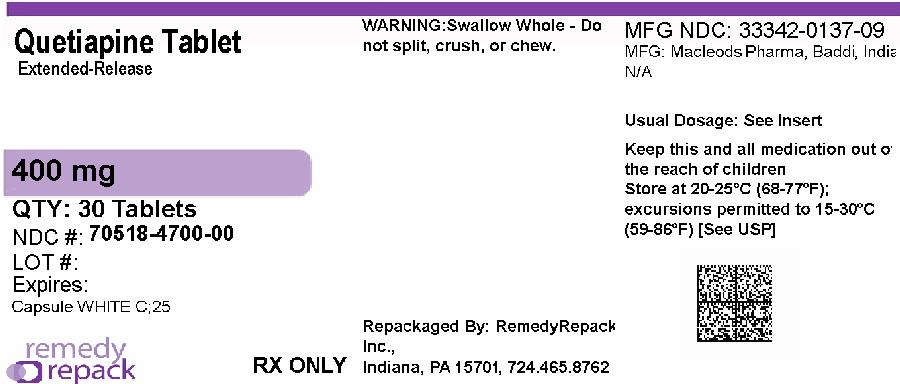
Quetiapine Tablet Extended-Release 400 mg, bottle label showing quantity of 30 tablets. Label includes warnings to swallow whole without splitting, crushing, or chewing. Manufactured by Macleods Pharma, India, repackaged by RemedyRepack Inc., Indiana. Storage instructions and barcode are visible.*
FDA Label Image

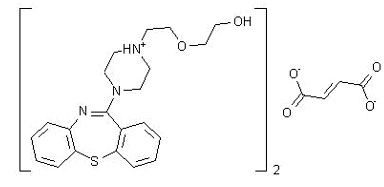
Quetiapine-fig-1 (Quetiapine Fig 1)

Quetiapine-fig-1 (Quetiapine Fig 1)
Chemical structure diagram showing the molecular structure of quetiapine, including its biphenyl-thiazepine moiety, and diphenyl oxalate. The diagram illustrates the arrangement of atoms and bonds in the quetiapine compound in detail.*
FDA Label Image

Quetiapine-fig-2 (Quetiapine Fig 2)

Quetiapine-fig-2 (Quetiapine Fig 2)
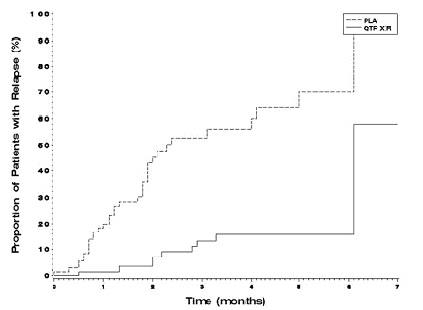
A Kaplan-Meier curve showing the proportion of patients with relapse (%) over time (months) comparing two groups: PLA (placebo) and QTF XR (Quetiapine Extended Release). The graph illustrates relapse rates increasing over seven months, with the placebo group showing a higher proportion of relapse compared to the Quetiapine XR group.*
FDA Label Image

Quetiapine-fig-3 (Quetiapine Fig 3)

Quetiapine-fig-3 (Quetiapine Fig 3)
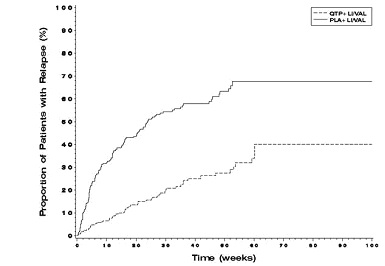
A line graph showing the proportion of patients with relapse (%) on the y-axis over time in weeks on the x-axis up to 100 weeks. Two curves are plotted, labeled as QTP + LIVAL and PLA + LIVAL, indicating comparative relapse rates for two treatment groups over time.*
FDA Label Image

Quetiapine-fig-4 (Quetiapine Fig 4)

Quetiapine-fig-4 (Quetiapine Fig 4)
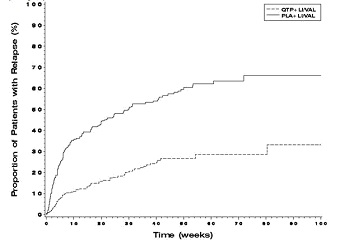
A line graph displaying the proportion of patients with relapse (%) over time in weeks. The graph compares two groups labeled QTP + LIVAL and PLA + LIVAL, showing their relapse rates up to 16 weeks.*

* About these descriptions: Image descriptions on this page are generated by automated AI analysis of the product label images from the manufacturer's FDA label submission (SPL). They are provided for reference only and may contain errors or omissions. Always rely on the printed label itself and the official FDA labeling, and consult a pharmacist or healthcare professional with any questions about this product.