Pregabalin Capsule
Product Images NDC 70518-4778

15 FDA label images from Remedyrepack Inc. · Packaging, Regulatory Labels, and Product Appearance

Product Visual Gallery

This gallery contains 15 technical images submitted to the FDA as part of the official labeling for Pregabalin (NDC 70518-4778). Unlike standard consumer photos, these assets often include clinical data figures, molecular chemical structures, and official manufacturer packaging layouts.

As provided by Remedyrepack Inc., these visuals offer a comprehensive scientific overview of the product's physical and chemical identity, aiding pharmacists and researchers in product verification and study.

FDA Label Image

Equation (Pregabain Gault Equation)

Equation (Pregabain Gault Equation)
A mathematical formula for calculating creatinine clearance (CLCr), adjusting for patient age, weight, serum creatinine levels, and gender, with a factor applied for female patients.*
FDA Label Image

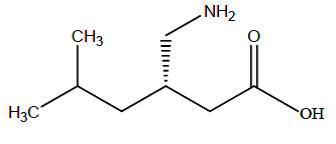
Str (Pregabalin Structure)

Str (Pregabalin Structure)
Chemical structure diagram of pregabalin, illustrating its molecular arrangement including functional groups such as an amino group (NH2), a carboxylic acid group (COOH), and a branched aliphatic side chain.*
FDA Label Image

Fig-01 (Pregabalin Figure 01)

Fig-01 (Pregabalin Figure 01)
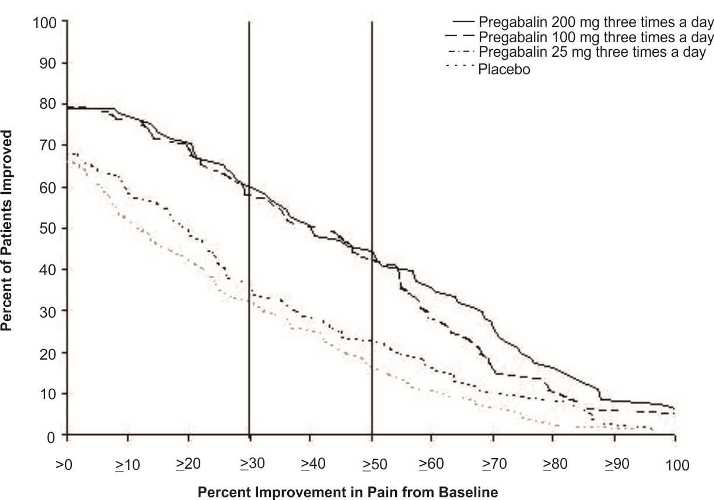
A line graph displaying the percent of patients improved versus percent improvement in pain from baseline for Pregabalin at dosages of 25 mg, 100 mg, and 200 mg three times daily compared to placebo. The graph shows decline trends for each group across varying levels of pain improvement.*
FDA Label Image

Fig-02 (Pregabalin Figure 02)

Fig-02 (Pregabalin Figure 02)
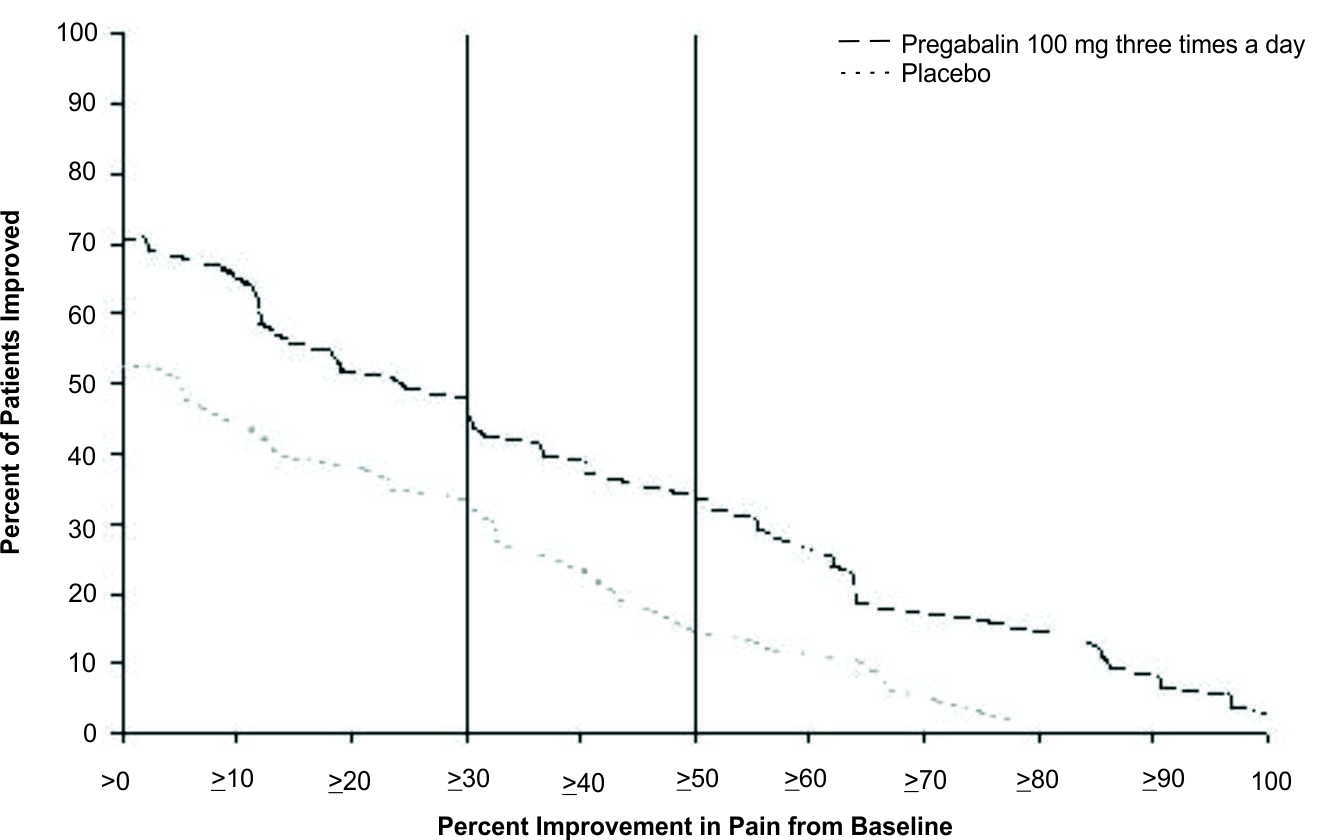
A Kaplan-Meier type graph showing percentile of patients improved versus percent improvement in pain from baseline. Two curves compare Pregabalin 100 mg three times a day (dashed line) and placebo (dotted line). The y-axis represents percent of patients improved from 0 to 100%, and the x-axis shows percent improvement in pain from baseline ranging greater than 0 to 100 percent.*
FDA Label Image

Fig-03 (Pregabalin Figure 03)

Fig-03 (Pregabalin Figure 03)
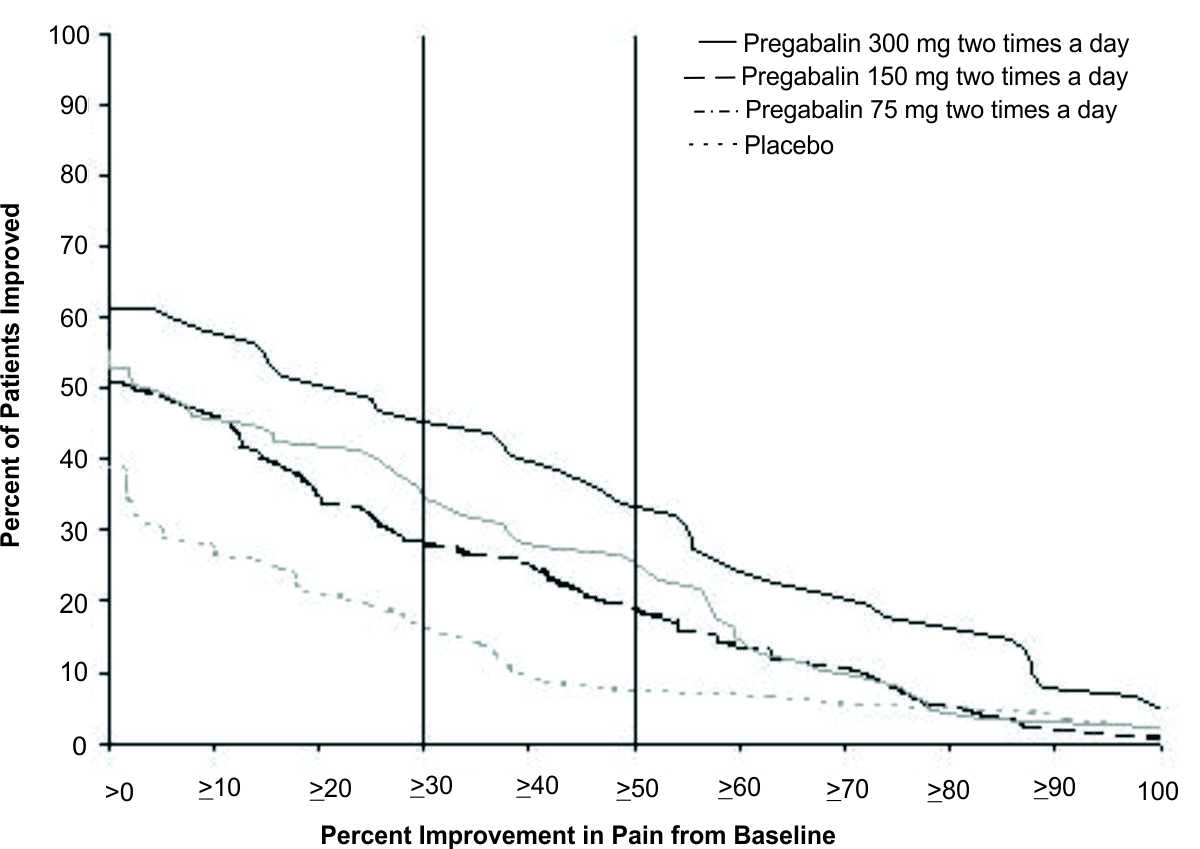
A line graph displaying the percent of patients improved versus percent improvement in pain from baseline. It compares the effects of Pregabalin at 300 mg, 150 mg, and 75 mg dosages taken twice daily with a placebo group. The graph depicts four lines representing these groups and shows how patient improvement varies across different percentages of pain improvement.*
FDA Label Image

Fig-04 (Pregabalin Figure 04)

Fig-04 (Pregabalin Figure 04)
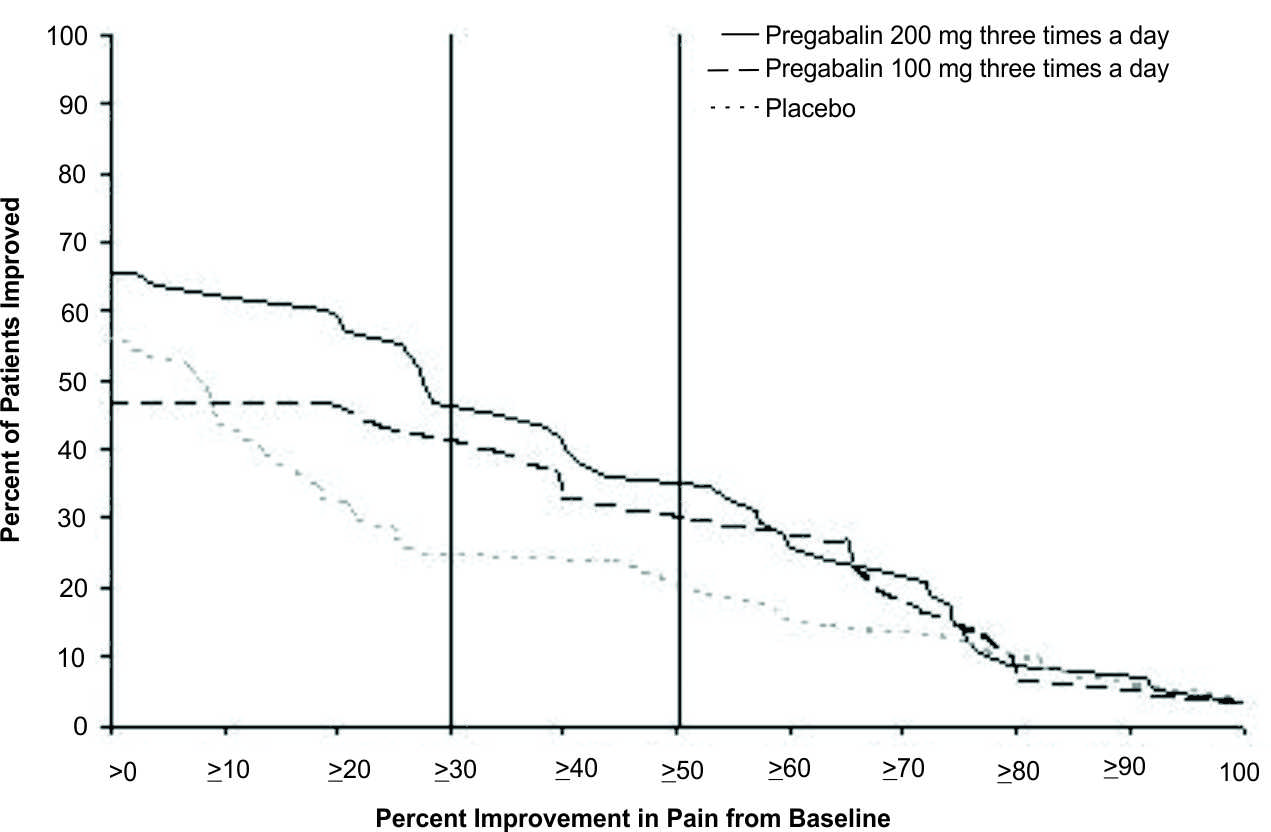
A Kaplan-Meier-type plot showing the percent of patients improved (y-axis) versus percent improvement in pain from baseline (x-axis) for three groups: Pregabalin 200 mg three times a day, Pregabalin 100 mg three times a day, and Placebo. The plot illustrates the comparative improvement in pain among the groups across different improvement thresholds.*
FDA Label Image

Fig-05 (Pregabalin Figure 05)

Fig-05 (Pregabalin Figure 05)
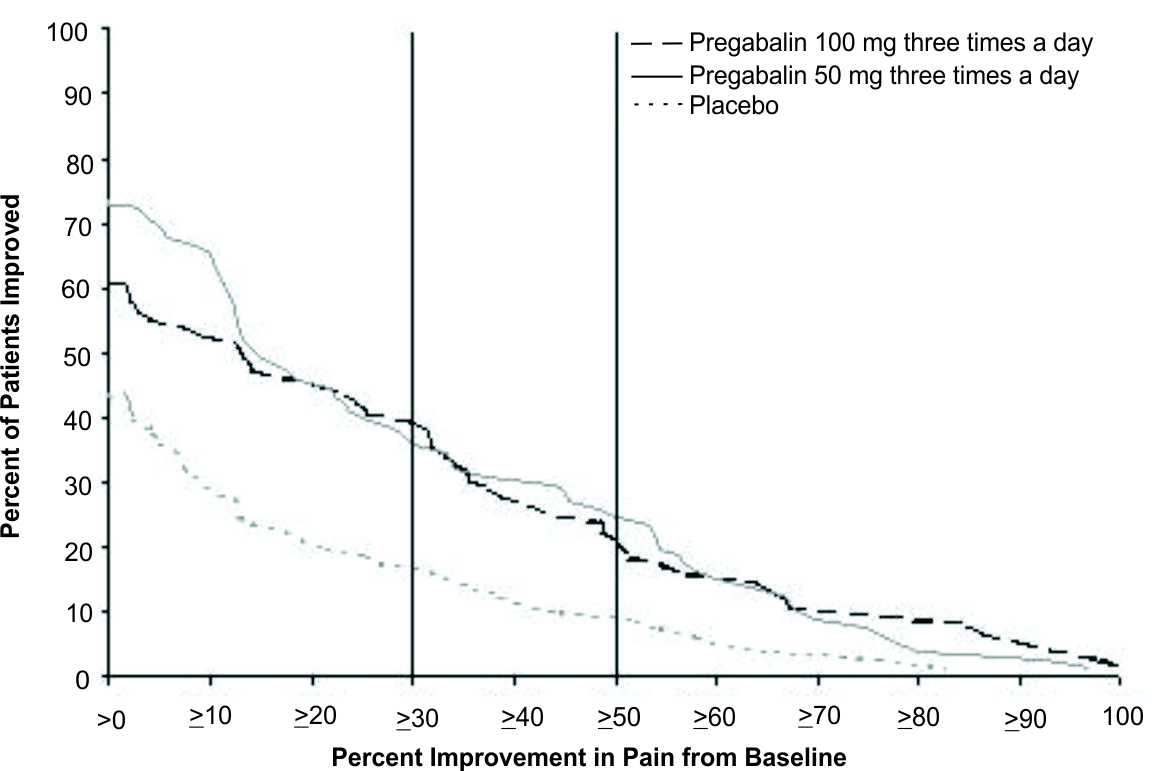
A line graph showing percent of patients improved on the vertical axis and percent improvement in pain from baseline on the horizontal axis. The graph compares three groups: Pregabalin 100 mg three times a day, Pregabalin 50 mg three times a day, and placebo, with distinct line styles for each. The graph illustrates patient response rates at various levels of pain improvement.*
FDA Label Image

Fig-06 (Pregabalin Figure 06)

Fig-06 (Pregabalin Figure 06)
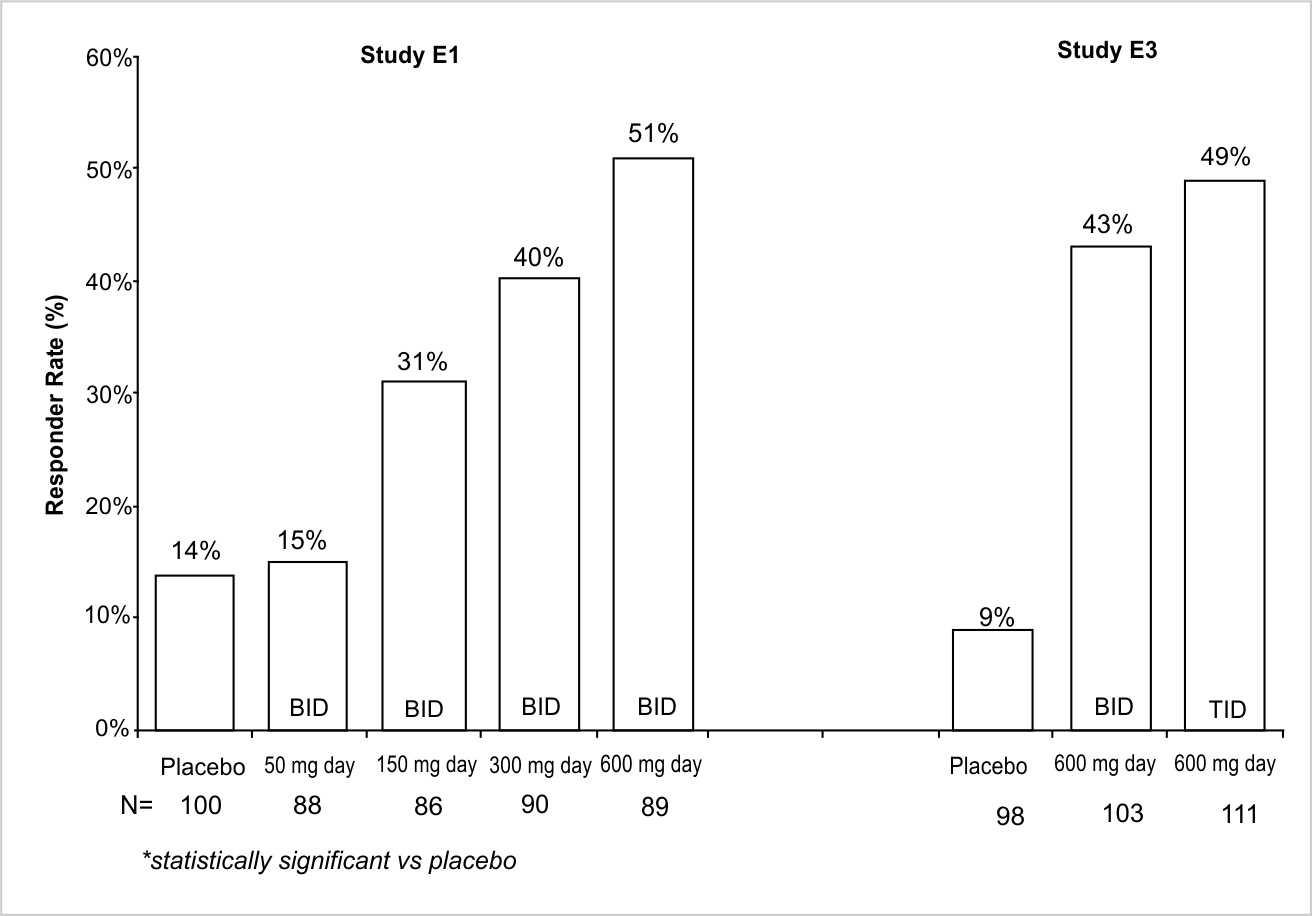
A bar chart showing responder rates (%) by dosage groups in two clinical studies labeled Study E1 and Study E3. Study E1 compares placebo, 50 mg, 150 mg, 300 mg, and 600 mg doses given twice daily (BID). Study E3 compares placebo, 600 mg BID, and 600 mg three times daily (TID). Sample sizes (N) are shown below each group. Statistically significant responder rates versus placebo are indicated.*
FDA Label Image

Fig-07 (Pregabalin Figure 07)

Fig-07 (Pregabalin Figure 07)
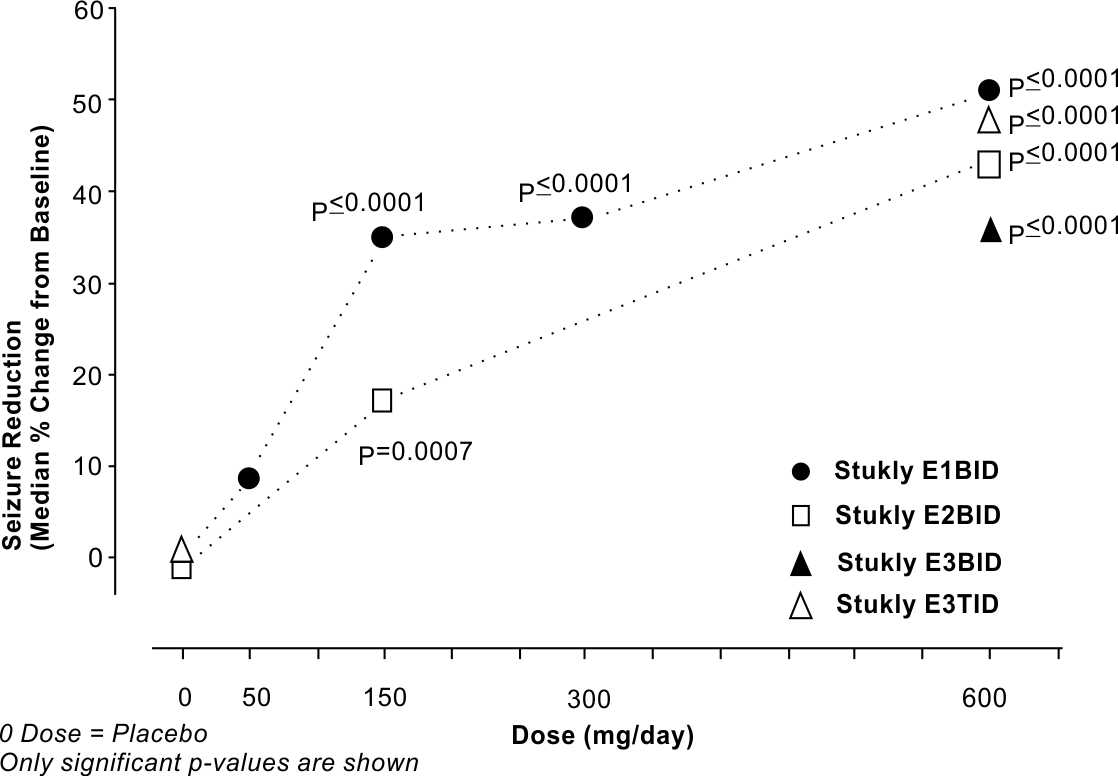
A line chart illustrating seizure reduction (median percentage change from baseline) versus dose in mg/day. The chart includes data series labeled Stukly E1BID, E2BID, E3BID, and E3TID, represented by different symbols. Statistical significance values (p-values) are noted alongside data points, highlighting significant differences at various doses up to 600 mg/day.*
FDA Label Image

Pregabalin-figure-08 (Pregabalin Figure 08)

Pregabalin-figure-08 (Pregabalin Figure 08)
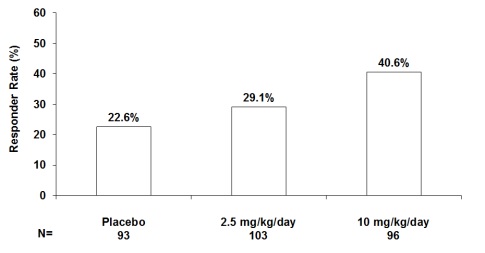
A bar graph showing responder rates in percentage for three groups: Placebo (22.6%, n=93), 2.5 mg/kg/day (29.1%, n=103), and 10 mg/kg/day (40.6%, n=96). The vertical axis is labeled 'Responder Rate (%)' and the horizontal axis lists the treatment groups with sample sizes beneath.*
FDA Label Image

Pregabalin-figure-09 (Pregabalin Figure 09)

Pregabalin-figure-09 (Pregabalin Figure 09)
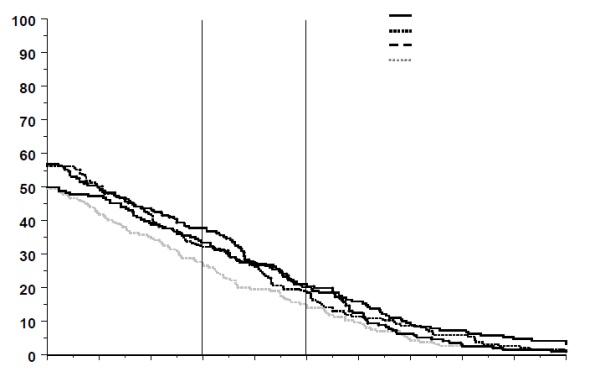
A line graph showing multiple curves representing data trends over a range from 0 to 100 on the vertical axis. The chart includes different line styles, including solid, dotted, dashed, and dotted-dashed, with two vertical reference lines plotted along the horizontal axis. Specific data labels and axis titles are not visible.*
FDA Label Image

Fig-10 (Pregabalin Figure 10)

Fig-10 (Pregabalin Figure 10)
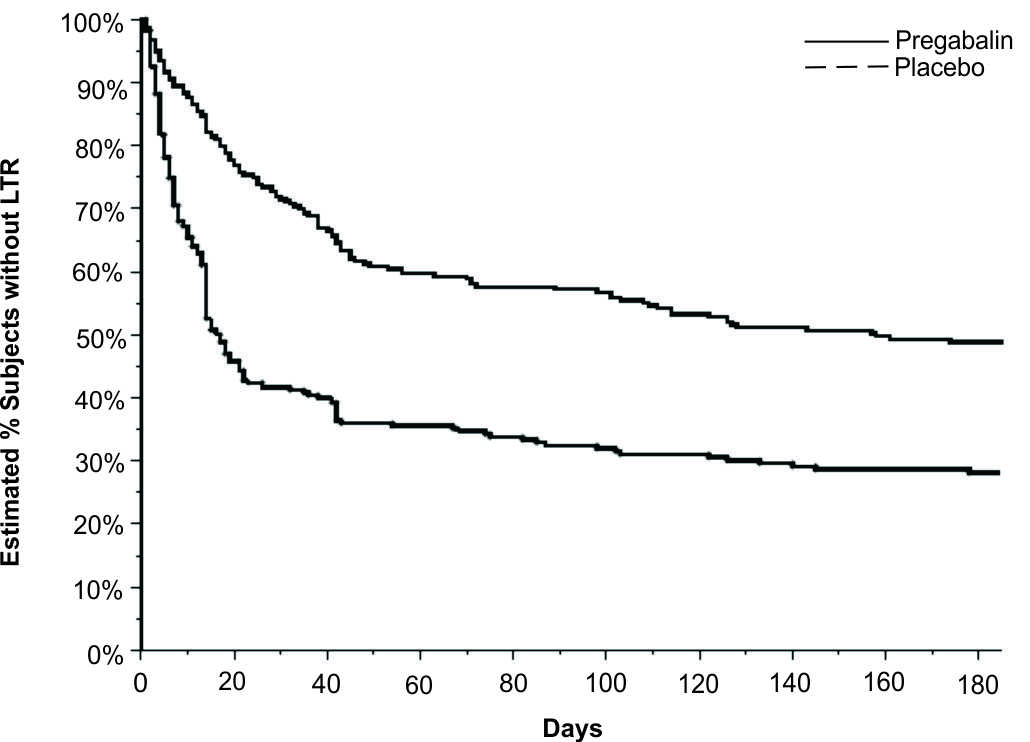
A Kaplan-Meier survival curve comparing Pregabalin and Placebo over 180 days. The vertical axis shows estimated percentage of subjects without LTR, and the horizontal axis shows days. Pregabalin data is represented by a solid line, placebo by a dashed line, illustrating greater retention without LTR in the Pregabalin group.*
FDA Label Image

Fig-11 (Pregabalin Figure 11)

Fig-11 (Pregabalin Figure 11)
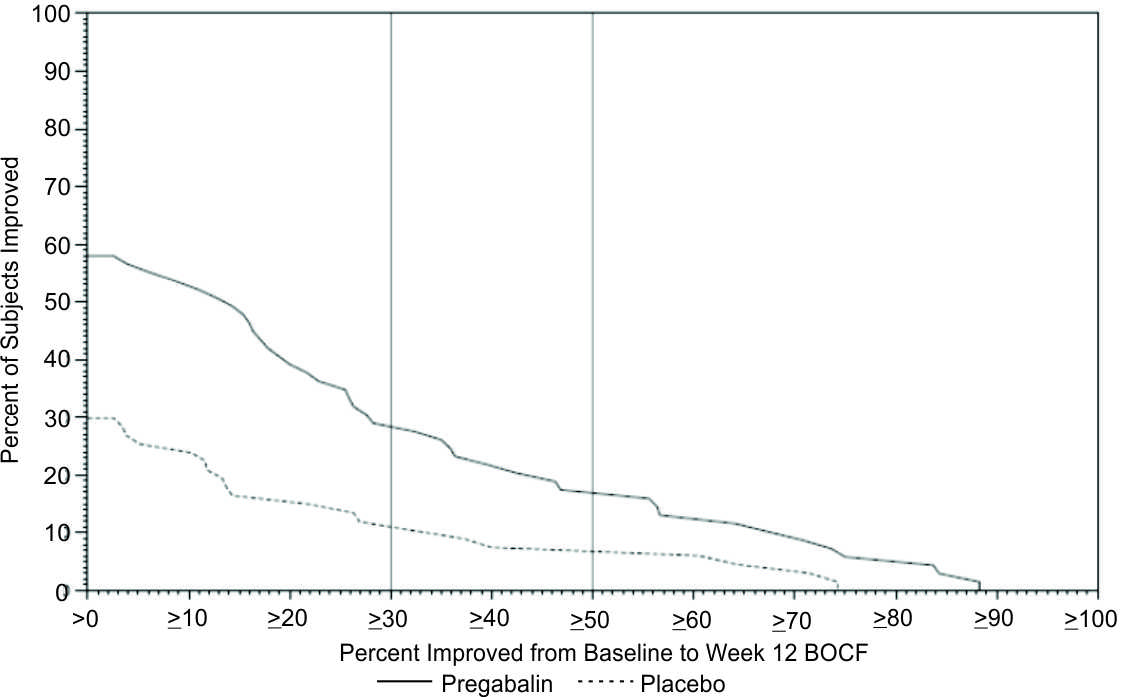
A line graph showing the percent of subjects improved comparing Pregabalin and Placebo over a range of percent improvement from baseline to week 12 using BOCF analysis. The y-axis represents the percentage of subjects improved, and the x-axis represents the percent improvement from baseline. Two lines are shown: a solid line for Pregabalin and a dashed line for Placebo, illustrating comparative improvement outcomes.*
FDA Label Image

Fig-12 (Pregabalin Figure 12)

Fig-12 (Pregabalin Figure 12)
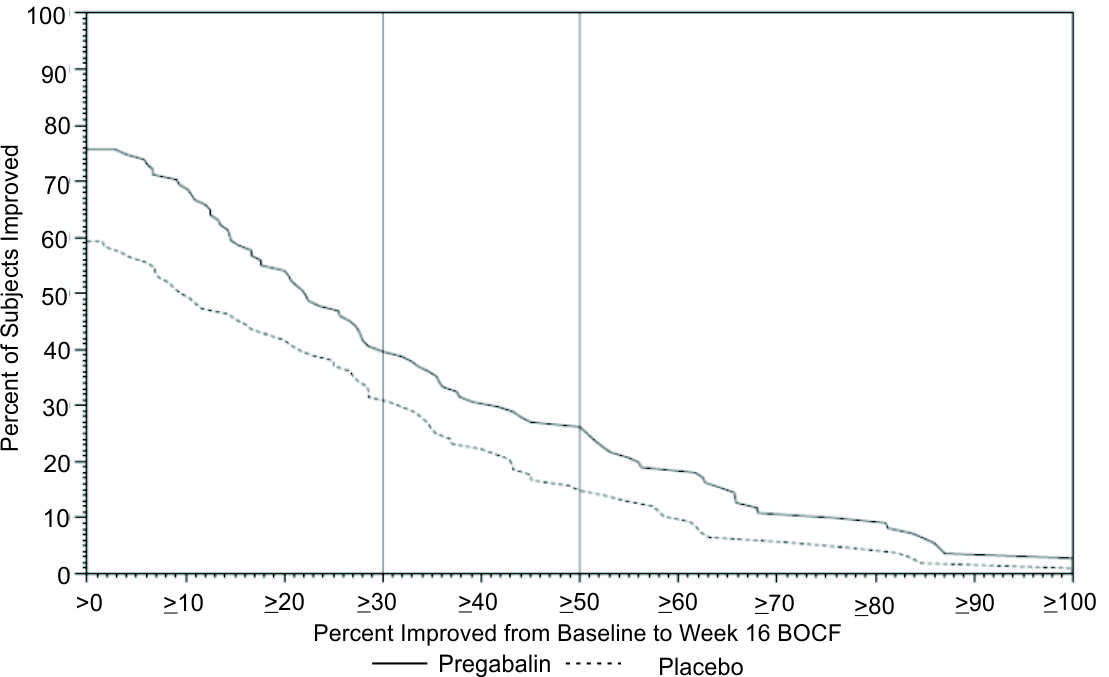
A cumulative distribution plot comparing the percent of subjects improved versus percent improvement from baseline to week 16 BOCF for Pregabalin versus Placebo. The x-axis represents percent improvement, and the y-axis shows percent of subjects improved. The graph includes two curves, one solid for Pregabalin and one dashed for Placebo.*
FDA Label Image

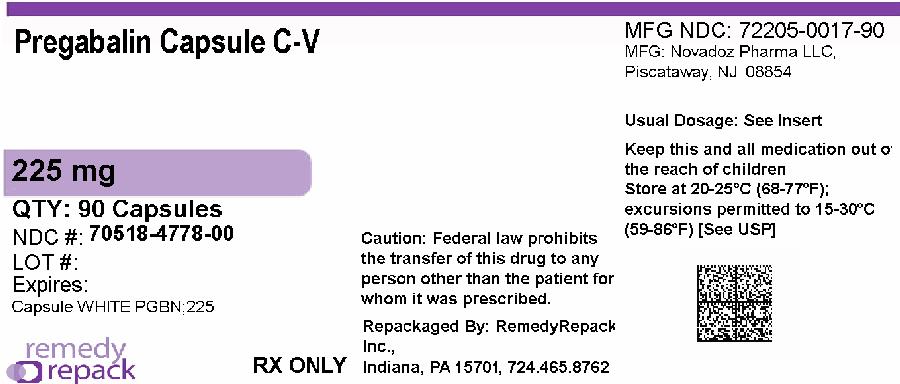
Remedy_label (Remedy Label)

Remedy_label (Remedy Label)
Pregabalin capsule C-V 225 mg label showing quantity of 90 capsules. The label includes the NDC number 70518-4778-00, repackager RemedyRepack Inc., and manufacturer Novadoz Pharma LLC. It provides storage instructions, federal caution about transfer, and states 'RX ONLY'.*

* About these descriptions: Image descriptions on this page are generated by automated AI analysis of the product label images from the manufacturer's FDA label submission (SPL). They are provided for reference only and may contain errors or omissions. Always rely on the printed label itself and the official FDA labeling, and consult a pharmacist or healthcare professional with any questions about this product.