Gemmily Kit
Product Images NDC 70700-152

9 FDA label images from Xiromed, Llc · Packaging, Regulatory Labels, and Product Appearance

Product Visual Gallery

This gallery contains 9 technical images submitted to the FDA as part of the official labeling for Gemmily (NDC 70700-152). Unlike standard consumer photos, these assets often include clinical data figures, molecular chemical structures, and official manufacturer packaging layouts.

As provided by Xiromed, Llc, these visuals offer a comprehensive scientific overview of the product's physical and chemical identity, aiding pharmacists and researchers in product verification and study.

FDA Label Image

Gemmily-carton (Gemmily Carton)

Gemmily-carton (Gemmily Carton)
Packaging label for Gemmily kit by Xiromed, LLC, containing norethindrone acetate and ethinyl estradiol capsules, and ferrous fumarate capsules. The label shows dosage strengths of 1 mg/20 mcg and indicates it provides 24 days of active therapy. The package includes 3 blister cards with a total of 28 soft gelatin capsules. NDC 70700-152-85 and Rx only markings are visible.*
FDA Label Image

Gemmily-blister-figure (Gemmily Blister Figure)

Gemmily-blister-figure (Gemmily Blister Figure)
An instructional diagram for Gemmily kit (norethindrone acetate and ethinyl estradiol, and ferrous fumarate capsules) showing a 4-week pill-taking schedule. It includes directions for Sunday starters and Day-1 starters, with days labeled Sunday through Saturday and arrows indicating the left to right direction to take pills each week.*
FDA Label Image

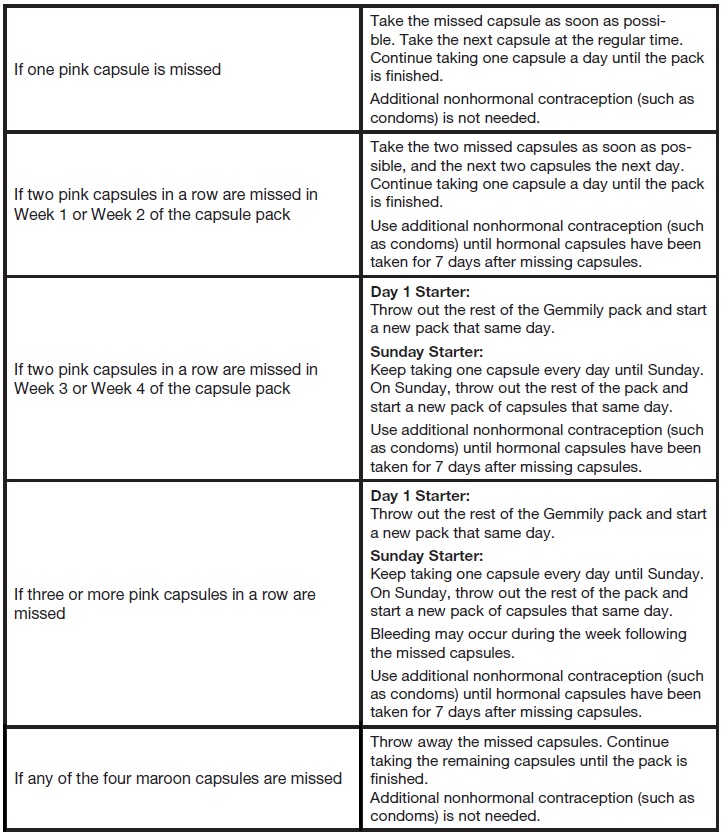
Gemmily-table-1.jpg (Table 1)

Gemmily-table-1.jpg (Table 1)
Instructional text panel for Gemmily kit explaining what to do if one or more pink capsules or any maroon capsules are missed. It details taking missed doses as soon as possible, continuing regular dosing, when to start a new pack, and advises on use of additional nonhormonal contraception when multiple pink capsules are missed in specific weeks of the pack.*
FDA Label Image

Figure 1. (Relative Studies Graph)

Figure 1. (Relative Studies Graph)
A forest plot chart illustrating the effect estimates from various studies on the risk of breast cancer associated with combined oral contraceptive (COC) use versus never use. The chart lists study names and years on the left, displays effect estimates and confidence intervals as horizontal lines crossing a central vertical line set at 1.0 on the x-axis, which is labeled 'Effect Estimate.' The right side presents odds ratios (OR), relative risks (RR), and hazard ratios (HR) with confidence intervals. The plot compares risk using combined oral contraceptives in different populations across multiple studies.*
FDA Label Image

The Following Structural Formula For The Chemical Name Of Ethinyl Estradiol Is [19-norpregna-1,3,5(10)-trien-20-yne-3,17-diol, (17a)-]. The Empirical Formula Of Ethinyl Estradiol Is C20h24o2. (Gemmily Figure 01)

The Following Structural Formula For The Chemical Name Of Ethinyl Estradiol Is [19-norpregna-1,3,5(10)-trien-20-yne-3,17-diol, (17a)-]. The Empirical Formula Of Ethinyl Estradiol Is C20h24o2. (Gemmily Figure 01)
Chemical structure diagram of the active ingredient ethinyl estradiol showing its molecular arrangement with labeled atoms.*
FDA Label Image

The Following Structural Formula For The Chemical Name Of Norethindrone Acetate Is [19-norpregn-4-en-20-yn-3-one, 17-(acetyloxy)-, (17a)-]. The Empirical Formula Of Norethindrone Acetate Is C22h28o3. (Gemmily Figure 02)

The Following Structural Formula For The Chemical Name Of Norethindrone Acetate Is [19-norpregn-4-en-20-yn-3-one, 17-(acetyloxy)-, (17a)-]. The Empirical Formula Of Norethindrone Acetate Is C22h28o3. (Gemmily Figure 02)
Chemical structure diagram of norethindrone acetate and ethinyl estradiol, the active ingredients in Gemmily. The diagram shows a steroidal backbone with functional groups including an acetoxy group and an ethynyl substituent.*
FDA Label Image

Figure 2. Mean Plasma Norethindrone Concentration-time Profiles Following Single- And Multiple-dose Oral Administration Of Norethindrone Acetate/ethinyl Estradiol Tablets To Healthy Female Volunteers Under Fasting Condition (n = 17) (Gemmily Figure 03)

Figure 2. Mean Plasma Norethindrone Concentration-time Profiles Following Single- And Multiple-dose Oral Administration Of Norethindrone Acetate/ethinyl Estradiol Tablets To Healthy Female Volunteers Under Fasting Condition (n = 17) (Gemmily Figure 03)
A line graph depicting norethindrone concentration (pg/mL) over time (hours) following dosing on Day 1 and Day 24. The graph shows a rapid increase and gradual decline in concentration, with Day 24 concentrations being higher and declining more slowly compared to Day 1.*
FDA Label Image

Figure 3. Mean Plasma Ethinyl Estradiol Concentration-time Profiles Following Single- And Multiple-dose Oral Administration Of Norethindrone Acetate/ethinyl Estradiol Tablets To Healthy Female Volunteers Under Fasting Condition (n = 17) (Gemmily Figure 04)

Figure 3. Mean Plasma Ethinyl Estradiol Concentration-time Profiles Following Single- And Multiple-dose Oral Administration Of Norethindrone Acetate/ethinyl Estradiol Tablets To Healthy Female Volunteers Under Fasting Condition (n = 17) (Gemmily Figure 04)
A line graph displaying Ethinyl Estradiol concentration (pg/mL) over time (hours) comparing Day 1 and Day 24. The concentration rises sharply at the start, with Day 24 showing higher levels and a more prolonged decline than Day 1, extending to 60 hours.*
FDA Label Image

The Following Chart Shows The Chance Of Getting Pregnant For Women Who Use Different Methods Of Birth Control. Each Box On The Chart Contains A List Of Birth Control Methods That Are Similar In Effectiveness. The Most Effective Methods Are At The Top Of The Chart. The Box On The Bottom Of The Chart Shows The Chance Of Getting Pregnant For Women Who Do Not Use Birth Control And Are Trying To Get Pregnant. (Gemmily Figure 05)

The Following Chart Shows The Chance Of Getting Pregnant For Women Who Use Different Methods Of Birth Control. Each Box On The Chart Contains A List Of Birth Control Methods That Are Similar In Effectiveness. The Most Effective Methods Are At The Top Of The Chart. The Box On The Bottom Of The Chart Shows The Chance Of Getting Pregnant For Women Who Do Not Use Birth Control And Are Trying To Get Pregnant. (Gemmily Figure 05)
An illustration diagram showing various birth control methods arranged vertically to indicate their relative effectiveness in preventing pregnancies per 100 women in one year. It ranges from fewer than 1 pregnancy with methods like implants, injections, intrauterine devices, and sterilization, to no birth control resulting in 85 or more pregnancies. Middle effectiveness groups include birth control pills, skin patch, vaginal ring with hormones, condoms, diaphragm, and behavioral methods like abstinence during fertile days, spermicide, and withdrawal.*

* About these descriptions: Image descriptions on this page are generated by automated AI analysis of the product label images from the manufacturer's FDA label submission (SPL). They are provided for reference only and may contain errors or omissions. Always rely on the printed label itself and the official FDA labeling, and consult a pharmacist or healthcare professional with any questions about this product.