Lojaimiess Kit
Product Images NDC 70700-207

View Photos of Packaging, Regulatory Labels, and Product Appearance

Product Visual Gallery

This gallery contains 8 technical images submitted to the FDA as part of the official labeling for Lojaimiess (NDC 70700-207). Unlike standard consumer photos, these assets often include clinical data figures, molecular chemical structures, and official manufacturer packaging layouts.

As provided by Xiromed Llc, these visuals offer a comprehensive scientific overview of the product's physical and chemical identity, aiding pharmacists and researchers in product verification and study.

FDA Label Image

Figure (50bc7836 Dbb6 439f 83b3 88f1f8758fc5 01)
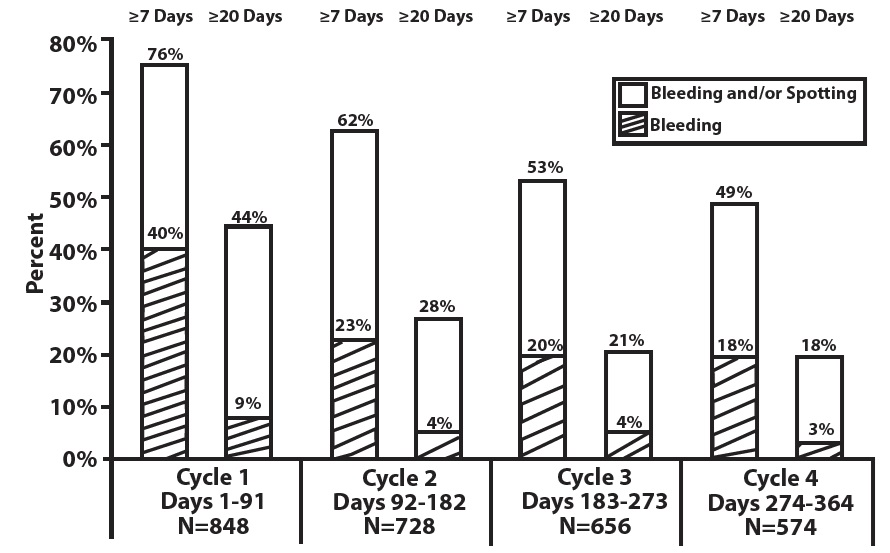
Figure (50bc7836 Dbb6 439f 83b3 88f1f8758fc5 01)
Bar chart showing percentages of bleeding and/or spotting and bleeding over time across four cycles of LOJAIMIESS use. Each cycle represents a 91-day period with declining percentages of patients experiencing bleeding and/or spotting and bleeding: Cycle 1 (days 1-91, N=848), Cycle 2 (days 92-182, N=728), Cycle 3 (days 183-273, N=656), and Cycle 4 (days 274-364, N=574). The chart separates data into durations of ≥7 days and ≥20 days for each cycle.*
FDA Label Image

Structure (50bc7836 Dbb6 439f 83b3 88f1f8758fc5 02)

Structure (50bc7836 Dbb6 439f 83b3 88f1f8758fc5 02)
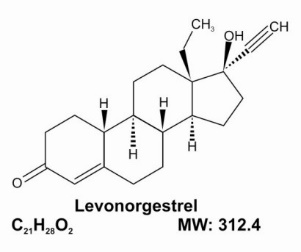
Chemical structure diagram of Levonorgestrel, showing its molecular formula C21H28O2 and molecular weight 312.4.*
FDA Label Image

Structure (50bc7836 Dbb6 439f 83b3 88f1f8758fc5 03)

Structure (50bc7836 Dbb6 439f 83b3 88f1f8758fc5 03)
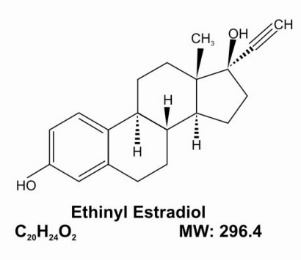
Chemical structure of Ethinyl Estradiol, showing its molecular formula C20H24O2 and molecular weight 296.4. The diagram illustrates the arrangement of atoms and bonds within the hormone molecule.*
FDA Label Image

Levonorgestrel And Ethinyl Estradiol Tablets, Usp (0.1 mg/ 0.02 mg) And Ethinyl Estradiol Tablets, Usp (0.01 mg) Carton Label (Image 01)

Levonorgestrel And Ethinyl Estradiol Tablets, Usp (0.1 mg/ 0.02 mg) And Ethinyl Estradiol Tablets, Usp (0.01 mg) Carton Label (Image 01)
LoJaimiess 0.1 mg/0.02 mg and 0.01 mg tablets kit by Xiromed LLC. The packaging indicates it contains Levonorgestrel and Ethinyl Estradiol Tablets, USP and Ethinyl Estradiol Tablets, USP in an extended-cycle blister pack, with 2 pouches each containing 91 tablets. The label highlights the dosage strengths and the total tablet count per pack.*
FDA Label Image

Image (Image 02)

Image (Image 02)
An illustration diagram showing pregnancy rates per 100 women in one year associated with different contraceptive methods. The diagram arranges methods vertically from fewer pregnancies to more pregnancies, listing implants, injections, intrauterine devices, and sterilization as having fewer pregnancies; birth control pills, skin patch, and vaginal rings with hormones as next; condoms and diaphragm below that; then no sex during fertile days, spermicide, and withdrawal; and no birth control associated with the most pregnancies.*
FDA Label Image

Blister (Image 03)

Blister (Image 03)
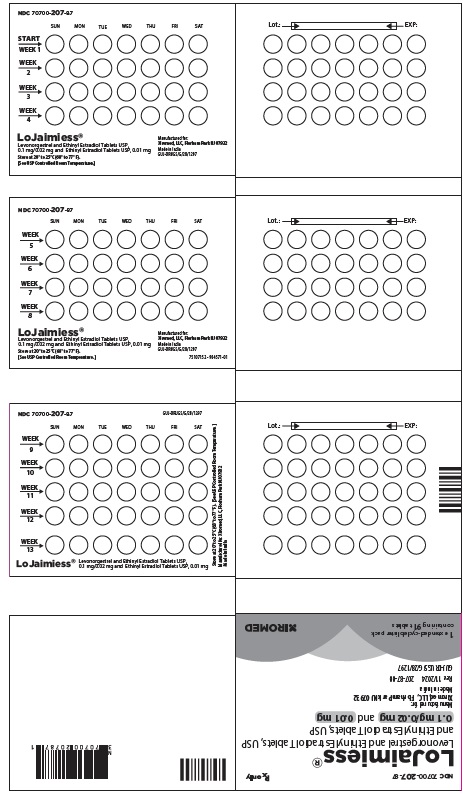
LoJaimiess kit containing Levonorgestrel and Ethinyl Estradiol tablets and Ethinyl Estradiol tablets in a multi-week pill pack. The label displays a calendar-style arrangement of tablet slots organized by day and week for a 13-week supply. Manufactured by Xiromed LLC, the kit includes detailed tablet identification and storage instructions.*
FDA Label Image

Figure 3: Relevant Studies Of Risk Of Breast Cancer With Combined Oral Contraceptives (Image 04)

Figure 3: Relevant Studies Of Risk Of Breast Cancer With Combined Oral Contraceptives (Image 04)
A forest plot titled 'Figure 3: Relevant Studies of Risk of Breast Cancer with Combined Oral Contraceptives' showing effect estimates (odds ratio, relative risk, hazard ratio) from multiple studies comparing risk among ever users versus never users of combined oral contraceptives (COCs) and current users versus never users. The horizontal axis ranges from -1.50 to 2.00 with a vertical reference line at 1.00. Study names and years are listed on the left, with corresponding effect estimates and confidence intervals plotted as points and horizontal lines. A legend explains RR, OR, and HR definitions, and the groups compared.*
FDA Label Image

Figure 1: Likelihood Of Developing A Vte (Image 05)

Figure 1: Likelihood Of Developing A Vte (Image 05)
A horizontal bar chart showing the number of women with a blood clot out of 10,000 women years (WY) for four groups: non-pregnant non-COC users (range 1 to 5), COC users (range 3 to 9), pregnancy (range 5 to 20), and postpartum (12 weeks only) with the highest range (40 to 65). A note clarifies pregnancy data is based on nine-month duration assumptions from reference studies.*

* About these descriptions: Image descriptions on this page are generated by automated AI analysis of the product label images from the manufacturer's FDA label submission (SPL). They are provided for reference only and may contain errors or omissions. Always rely on the printed label itself and the official FDA labeling, and consult a pharmacist or healthcare professional with any questions about this product.