Abigale Tablet
Product Images NDC 70700-330

View Photos of Packaging, Regulatory Labels, and Product Appearance

Product Visual Gallery

This gallery contains 12 technical images submitted to the FDA as part of the official labeling for Abigale (NDC 70700-330). Unlike standard consumer photos, these assets often include clinical data figures, molecular chemical structures, and official manufacturer packaging layouts.

As provided by Xiromed Llc, these visuals offer a comprehensive scientific overview of the product's physical and chemical identity, aiding pharmacists and researchers in product verification and study.

FDA Label Image

Estradiol Structural Formula (Image 01)

Estradiol Structural Formula (Image 01)
Chemical structure of estradiol, showing a steroid skeleton with hydroxyl groups at specific positions, labeled as Estradiol.*
FDA Label Image

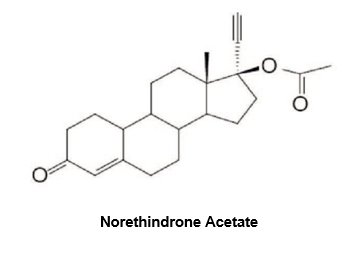
Norethindrone Acetate Structural Formula (Image 02)

Norethindrone Acetate Structural Formula (Image 02)
Chemical structure of norethindrone acetate as shown in the image, depicting its molecular framework with rings and functional groups clearly illustrated.*
FDA Label Image

Figure 1a: Mean Baseline-uncorrected Estradiol And Estrone Serum Concentration-time Profiles Following Multiple Doses Of Estradiol And Norethindrone Acetate Tablets 1 mg/0.5 mg (n=24) (Image 03)

Figure 1a: Mean Baseline-uncorrected Estradiol And Estrone Serum Concentration-time Profiles Following Multiple Doses Of Estradiol And Norethindrone Acetate Tablets 1 mg/0.5 mg (n=24) (Image 03)
A line graph showing plasma concentration levels (pg/ml) of Estradiol and Estrone over a 24-hour period. The x-axis represents time in hours, and the y-axis represents concentration levels. Estrone levels peak higher and earlier than Estradiol levels and then decline over time.*
FDA Label Image

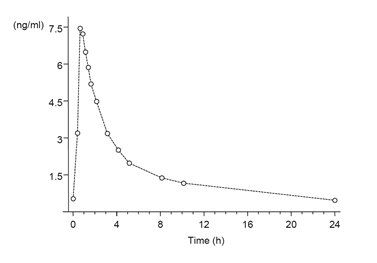
Figure 1b: Mean Baseline-uncorrected Norethindrone Serum Concentration-time Profile Following Multiple Doses Of Estradiol And Norethindrone Acetate Tablets 1 mg/0.5 mg (n=24) (Image 04)

Figure 1b: Mean Baseline-uncorrected Norethindrone Serum Concentration-time Profile Following Multiple Doses Of Estradiol And Norethindrone Acetate Tablets 1 mg/0.5 mg (n=24) (Image 04)
A line graph showing the concentration of a substance (ng/ml) over time (hours), starting at 0 and peaking just above 7 ng/ml before gradually declining to near zero by 24 hours.*
FDA Label Image

Figure 2: Mean Weekly Number Of Moderate And Severe Hot Flushes In A 12-week Study (Image 05)

Figure 2: Mean Weekly Number Of Moderate And Severe Hot Flushes In A 12-week Study (Image 05)
A line graph showing the number of moderate to severe hot flushes per week over 12 weeks for three groups: placebo, 1 mg estradiol, and estradiol and norethindrone acetate tablets 1 mg/0.5 mg. The graph displays a decreasing trend in hot flushes for treatment groups compared to placebo.*
FDA Label Image

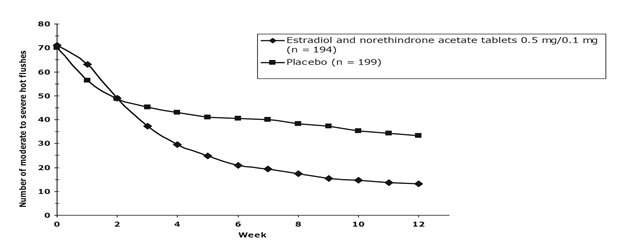
Figure 3: Mean Number Of Moderate To Severe Hot Flushes For Weeks 0 Through 12 (Image 06)

Figure 3: Mean Number Of Moderate To Severe Hot Flushes For Weeks 0 Through 12 (Image 06)
A line graph comparing the number of moderate to severe hot flushes over 12 weeks between estradiol and norethindrone acetate tablets 0.5 mg/0.1 mg and placebo groups. The graph shows a decreasing trend in hot flushes for the estradiol and norethindrone acetate group compared to a relatively stable level in the placebo group.*
FDA Label Image

Figure 4: Patients Treated With Estradiol And Norethindrone Acetate Tablets 1 mg/0.5 mg With Cumulative Amenorrhea Over Time Percentage Of Women With No Bleeding Or Spotting At Any Cycle Through Cycle 13 Intent To Treat Population, Locf (Image 07)

Figure 4: Patients Treated With Estradiol And Norethindrone Acetate Tablets 1 mg/0.5 mg With Cumulative Amenorrhea Over Time Percentage Of Women With No Bleeding Or Spotting At Any Cycle Through Cycle 13 Intent To Treat Population, Locf (Image 07)
A line graph comparing the percentage of women over 12 cycles for two groups: 1 mg E2 (n=293) and estradiol and norethindrone acetate tablets (n=290). The graph shows increasing percentages for both groups, with the estradiol and norethindrone acetate group generally having higher percentages across cycles.*
FDA Label Image

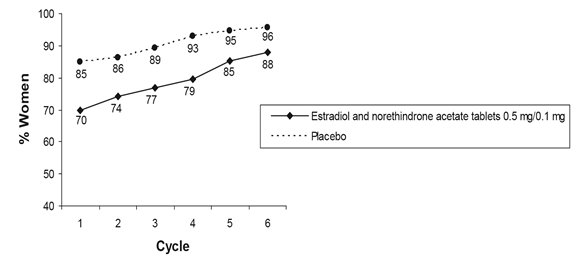
Figure 5: Patients Treated With Estradiol And Norethindrone Acetate Tablets 0.5 mg/0.1 mg With Cumulative Amenorrhea Over Time Percentage Of Women With No Bleeding Or Spotting At Any Cycle Through Cycle 6, Intent To Treat Population, Locf (Image 08)

Figure 5: Patients Treated With Estradiol And Norethindrone Acetate Tablets 0.5 mg/0.1 mg With Cumulative Amenorrhea Over Time Percentage Of Women With No Bleeding Or Spotting At Any Cycle Through Cycle 6, Intent To Treat Population, Locf (Image 08)
A line graph comparing the percentage of women over six cycles between two groups: one taking estradiol and norethindrone acetate tablets 0.5 mg/0.1 mg, and a placebo group. The x-axis represents cycle number (1 to 6), and the y-axis shows the percentage of women, ranging from 40% to 100%. The placebo group has consistently higher percentages than the active drug group across cycles.*
FDA Label Image

Figure 6: Percentage Change In Bone Mineral Density (bmd) ± Sem Of The Lumbar Spine (l1-l4) For Estradiol And Norethindrone Acetate Tablets 1 mg/0.5 mg And Estradiol 0.5 mg (intent To Treat Analysis With Last Observation Carried Forward) (Image 09)

Figure 6: Percentage Change In Bone Mineral Density (bmd) ± Sem Of The Lumbar Spine (l1-l4) For Estradiol And Norethindrone Acetate Tablets 1 mg/0.5 mg And Estradiol 0.5 mg (intent To Treat Analysis With Last Observation Carried Forward) (Image 09)
A line graph showing percentage change over lunar months (28-day cycles) for different treatment groups: estradiol and norethindrone acetate tablets 1 mg/0.5 mg in EU and US populations, estradiol 0.5 mg in US, and placebo groups in both EU and US. The graph illustrates trends and differences in response over time with error bars indicating variability.*
FDA Label Image

Patient Information Figure 1 (Image 10)

Patient Information Figure 1 (Image 10)
ABIGALE (Estradiol and Norethindrone Acetate) oral tablets, USP 1 mg/0.5 mg, labeled for 28 tablets. The label shows a weekly dosing calendar with days Sunday through Saturday and indicates storage instructions to keep the tablets in a dry place protected from light at 20° to 25°C (68° to 77°F). The product is from Xiromed LLC.*
FDA Label Image

Estradiol And Noretindrone Acetate Tablets 0.5 mg/0.1 mg Label (Image 11)

Estradiol And Noretindrone Acetate Tablets 0.5 mg/0.1 mg  Label (Image 11)
The packaging label for Abigale Lo tablets contains estradiol and norethindrone acetate at strengths of 0.5 mg and 0.1 mg respectively. The product is an oral prescription tablet by Xiromed LLC. The carton states it includes 3 pouches, each containing one blister pack of 28 tablets. The label features green and purple design elements with NDC 70700-303-85.*
FDA Label Image

Estradiol And Noretindrone Acetate Tablets 1 mg/0.5 mg Label (Image 12)

Estradiol And Noretindrone Acetate Tablets 1 mg/0.5 mg  Label (Image 12)
Packaging label for Abigale 1 mg/0.5 mg tablets containing estradiol and norethindrone acetate, USP. The label indicates oral tablet dosage form and specifies there are 3 pouches, each with one blister pack of 28 tablets. The labeler is Xiromed LLC, and the package is marked Rx only with NDC 70700-330-85.*

* About these descriptions: Image descriptions on this page are generated by automated AI analysis of the product label images from the manufacturer's FDA label submission (SPL). They are provided for reference only and may contain errors or omissions. Always rely on the printed label itself and the official FDA labeling, and consult a pharmacist or healthcare professional with any questions about this product.