Vardenafil Tablet, Film Coated
Product Images NDC 70710-1071

13 FDA label images from Zydus Pharmaceuticals Usa Inc. · Packaging, Regulatory Labels, and Product Appearance

Product Visual Gallery

This gallery contains 13 technical images submitted to the FDA as part of the official labeling for Vardenafil (NDC 70710-1071). Unlike standard consumer photos, these assets often include clinical data figures, molecular chemical structures, and official manufacturer packaging layouts.

As provided by Zydus Pharmaceuticals Usa Inc., these visuals offer a comprehensive scientific overview of the product's physical and chemical identity, aiding pharmacists and researchers in product verification and study.

FDA Label Image

28de859a C626 4ead A14a 8e3e18a2b048 01

28de859a C626 4ead A14a 8e3e18a2b048 01
Chemical structure of vardenafil as depicted in the image, showing its molecular framework including aromatic rings, sulfonyl, and heterocyclic components, consistent with the active pharmaceutical ingredient vardenafil.*
FDA Label Image

28de859a C626 4ead A14a 8e3e18a2b048 02

28de859a C626 4ead A14a 8e3e18a2b048 02
A set of three line graphs displaying mean maximal changes over time in systolic blood pressure, diastolic blood pressure, and heart rate associated with the timing of vardenafil treatment prior to NTG administration. Each graph shows values at 24h, 8h, 4h, and 1h, with error bars representing variability around the mean.*
FDA Label Image

28de859a C626 4ead A14a 8e3e18a2b048 03

28de859a C626 4ead A14a 8e3e18a2b048 03
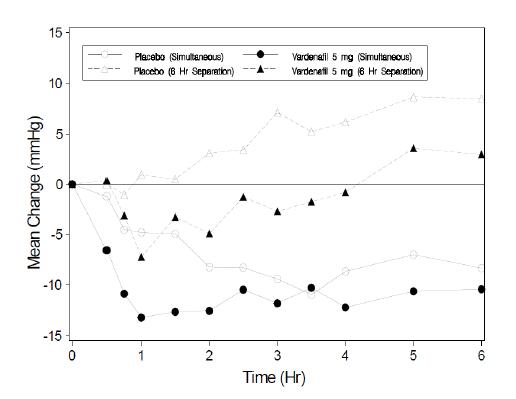
A line graph showing mean change in mmHg over time (0 to 6 hours) for placebo and Vardenafil 5 mg under simultaneous and 6-hour separation conditions. The y-axis measures mean change (mmHg) ranging from -15 to 15, and the x-axis represents time in hours. Different symbols represent each treatment condition as indicated in the legend.*
FDA Label Image

28de859a C626 4ead A14a 8e3e18a2b048 04

28de859a C626 4ead A14a 8e3e18a2b048 04
A line graph showing the mean change in mmHg over time in hours (0 to 6 hours) comparing placebo and Vardenafil 5 mg under simultaneous and 6-hour separation conditions. The graph includes four data series represented by different symbols, illustrating how each treatment affects the mean change differently over the 6-hour period.*
FDA Label Image

28de859a C626 4ead A14a 8e3e18a2b048 05

28de859a C626 4ead A14a 8e3e18a2b048 05
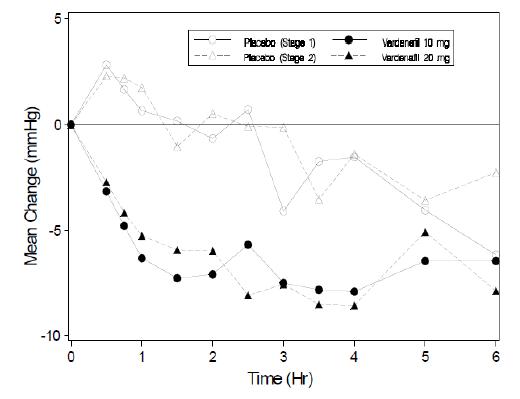
A line graph depicting mean change in mmHg over time (hours) comparing placebo and Vardenafil at 10 mg and 20 mg doses. The graph includes two placebo stages and shows a decrease in mean change with Vardenafil doses compared to placebo over a 6-hour period.*
FDA Label Image

28de859a C626 4ead A14a 8e3e18a2b048 06

28de859a C626 4ead A14a 8e3e18a2b048 06
A line graph showing mean change in blood pressure (mmHg) over time (hours) for Vardenafil 5 mg, Vardenafil 10 mg, and corresponding placebo groups across two stages. The x-axis represents time in hours from 0 to 6, and the y-axis represents mean change in blood pressure, ranging from -10 to 10 mmHg. Four distinct data series are displayed with different markers and lines comparing Vardenafil doses and placebos.*
FDA Label Image

28de859a C626 4ead A14a 8e3e18a2b048 07

28de859a C626 4ead A14a 8e3e18a2b048 07
A line graph titled 'TERAZOSIN' depicting mean change in mmHg over time (hours) for placebo and vardenafil doses (10 mg and 20 mg) under 6-hour separation and simultaneous administration conditions. The y-axis shows mean change in mmHg and the x-axis shows time from 0 to 6 hours.*
FDA Label Image

28de859a C626 4ead A14a 8e3e18a2b048 08

28de859a C626 4ead A14a 8e3e18a2b048 08
A line graph titled 'Tamsulosin' showing mean change in blood pressure (mmHg) over time (hours) for placebo and Vardenafil doses (10 mg and 20 mg) under two conditions: 6-hour separation and simultaneous administration. Symbols differentiate each group, illustrating the blood pressure trends over six hours.*
FDA Label Image

28de859a C626 4ead A14a 8e3e18a2b048 09

28de859a C626 4ead A14a 8e3e18a2b048 09
A pharmacokinetic graph showing plasma concentration (µg/L) of vardenafil over time (hours). The curve rises to a peak concentration within the first 1-2 hours and then declines steadily over 24 hours, with error bars indicating variability at each time point.*
FDA Label Image

28de859a C626 4ead A14a 8e3e18a2b048 10

28de859a C626 4ead A14a 8e3e18a2b048 10
Label for Vardenafil Hydrochloride Tablets 2.5 mg, film-coated oral tablets. The label indicates a bottle containing 30 tablets, prescription only. It includes the NDC number 70710-1068-3 and mentions the product is manufactured by Cadila Healthcare Ltd. in India and distributed by Zydus Pharmaceuticals USA Inc. The label features storage instructions and dosage notes.*
FDA Label Image

28de859a C626 4ead A14a 8e3e18a2b048 11

28de859a C626 4ead A14a 8e3e18a2b048 11
Vardenafil Hydrochloride Tablets 5 mg film-coated tablets packaging label. The label shows the product name, strength, and quantity of 30 tablets. It includes directions to keep out of children's reach, storage instructions, and manufacturer/distributor information for Zydus Pharmaceuticals USA Inc. The label features a barcode and the NDC number 70710-1069-3.*
FDA Label Image

28de859a C626 4ead A14a 8e3e18a2b048 12

28de859a C626 4ead A14a 8e3e18a2b048 12
Label for Vardenafil Hydrochloride Tablets 10 mg, film-coated oral tablets. The package contains 30 tablets for prescription use only, produced by Cadila Healthcare Ltd., India, and distributed by Zydus Pharmaceuticals USA Inc. The label includes storage instructions and dosage information.*
FDA Label Image

28de859a C626 4ead A14a 8e3e18a2b048 13

28de859a C626 4ead A14a 8e3e18a2b048 13
Label for Vardenafil Hydrochloride Tablets, 20 mg strength, film-coated oral tablets. The label shows 30 tablets per package, prescription only. It includes storage instructions, manufacturer Cadila Healthcare Ltd. (India), and distributor Zydus Pharmaceuticals USA Inc. The NDC number 70710-1071-3 is displayed at the top.*

* About these descriptions: Image descriptions on this page are generated by automated AI analysis of the product label images from the manufacturer's FDA label submission (SPL). They are provided for reference only and may contain errors or omissions. Always rely on the printed label itself and the official FDA labeling, and consult a pharmacist or healthcare professional with any questions about this product.