Mirabegron Tablet, Extended Release
Product Images NDC 70710-1159

View Photos of Packaging, Regulatory Labels, and Product Appearance

Product Visual Gallery

This gallery contains 11 technical images submitted to the FDA as part of the official labeling for Mirabegron (NDC 70710-1159). Unlike standard consumer photos, these assets often include clinical data figures, molecular chemical structures, and official manufacturer packaging layouts.

As provided by Zydus Pharmaceuticals (usa) Inc., these visuals offer a comprehensive scientific overview of the product's physical and chemical identity, aiding pharmacists and researchers in product verification and study.

FDA Label Image

Structure (Fe06b979 134e 4ba2 9f86 Ab442a3562a1 01)

Structure (Fe06b979 134e 4ba2 9f86 Ab442a3562a1 01)
Chemical structure diagram of mirabegron, illustrating its molecular arrangement including aromatic rings and functional groups as depicted in the image.*
FDA Label Image

Figure 1 (Fe06b979 134e 4ba2 9f86 Ab442a3562a1 02)

Figure 1 (Fe06b979 134e 4ba2 9f86 Ab442a3562a1 02)
A chart showing the mean fold change and 90% confidence intervals for pharmacokinetic measures (AUC and Cmax) of Mirabegron when co-administered with various CYP3A/Pgp inhibitors/inducers and other drugs. The graph compares these changes relative to Mirabegron alone, with recommendations indicating no dose adjustment needed for all listed drugs, including Ketoconazole, Rifampicin, Solifenacin, Tamsulosin, and Metformin.*
FDA Label Image

Figure 2 (Fe06b979 134e 4ba2 9f86 Ab442a3562a1 03)

Figure 2 (Fe06b979 134e 4ba2 9f86 Ab442a3562a1 03)
A bar graph showing the mean fold change in pharmacokinetic parameters AUC and Cmax relative to substrates alone for various drugs metabolized by CYP3A4, CYP2D6, and other enzymes. The graph includes drug names, doses, and corresponding dose adjustment recommendations, illustrating variability in drug interactions with Mirabegron.*
FDA Label Image

Figure 3 (Fe06b979 134e 4ba2 9f86 Ab442a3562a1 04)

Figure 3 (Fe06b979 134e 4ba2 9f86 Ab442a3562a1 04)
A line graph depicting the mean change from baseline over 12 weeks for two groups: placebo (n=291) and mirabegron 50 mg (n=293). The x-axis represents time in weeks (Baseline, 4, 8, 12), and the y-axis shows mean change from baseline. Data points include error bars indicating variability. Mirabegron shows a greater decrease in the measured variable compared to placebo over time.*
FDA Label Image

Figure 4 (Fe06b979 134e 4ba2 9f86 Ab442a3562a1 05)

Figure 4 (Fe06b979 134e 4ba2 9f86 Ab442a3562a1 05)
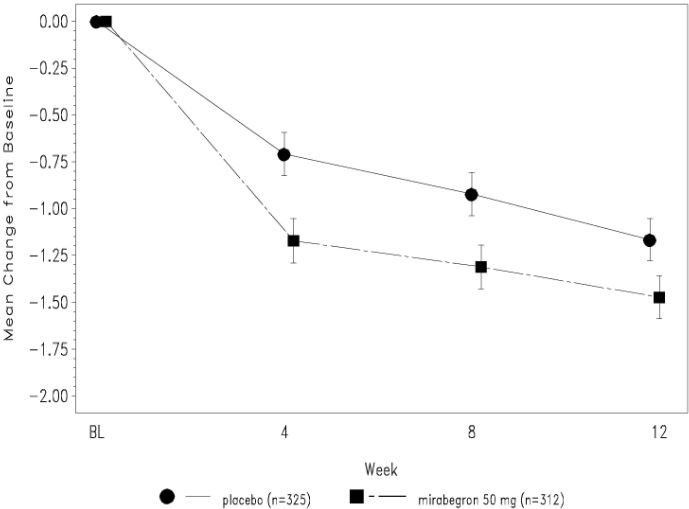
A line chart showing the mean change from baseline over 12 weeks for placebo and Mirabegron 50 mg groups. The x-axis represents weeks (BL, 4, 8, 12) and the y-axis shows the mean change from baseline. Data points for placebo (n=480) are marked with circles and Mirabegron 50 mg (n=473) with squares, with error bars for variability.*
FDA Label Image

Figure 5 (Fe06b979 134e 4ba2 9f86 Ab442a3562a1 06)

Figure 5 (Fe06b979 134e 4ba2 9f86 Ab442a3562a1 06)
A line graph showing mean change from baseline over 12 weeks for placebo and mirabegron 50 mg groups. The x-axis represents weeks (baseline, 4, 8, 12), and the y-axis shows mean change from baseline, with mirabegron exhibiting a greater decrease than placebo at each time point.*
FDA Label Image

Figure 6 (Fe06b979 134e 4ba2 9f86 Ab442a3562a1 07)

Figure 6 (Fe06b979 134e 4ba2 9f86 Ab442a3562a1 07)
A line graph showing mean change from baseline over 12 weeks comparing placebo and mirabegron 50 mg. The x-axis represents time in weeks (baseline, 4, 8, 12), and the y-axis shows mean change from baseline with data points plotted for placebo and mirabegron 50 mg groups. Error bars indicate variability at each time point.*
FDA Label Image

Figure 7 (Fe06b979 134e 4ba2 9f86 Ab442a3562a1 08)

Figure 7 (Fe06b979 134e 4ba2 9f86 Ab442a3562a1 08)
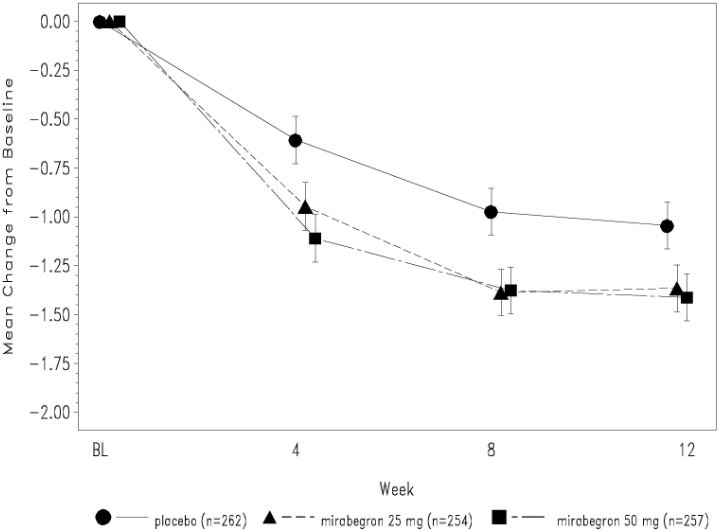
A line graph showing the mean change from baseline over 12 weeks for three groups: placebo, mirabegron 25 mg, and mirabegron 50 mg. The x-axis represents the weeks (baseline, 4, 8, 12), and the y-axis shows the mean change from baseline. Data points include error bars for variability.*
FDA Label Image

Figure 8 (Fe06b979 134e 4ba2 9f86 Ab442a3562a1 09)

Figure 8 (Fe06b979 134e 4ba2 9f86 Ab442a3562a1 09)
A line graph showing the mean change from baseline over 12 weeks for placebo and mirabegron extended-release tablets at 25 mg and 50 mg doses. The x-axis represents time in weeks (baseline, 4, 8, and 12 weeks), and the y-axis shows mean change from baseline. Data points with error bars are plotted for each group, depicting trends over time.*
FDA Label Image

Mirabegron Extended-release Tablets, 25mg (Fe06b979 134e 4ba2 9f86 Ab442a3562a1 10)

Mirabegron Extended-release Tablets, 25mg (Fe06b979 134e 4ba2 9f86 Ab442a3562a1 10)
Label for Mirabegron Extended-Release Tablets 25 mg by Zydus Pharmaceuticals (USA) Inc. The label shows the product name, strength, dosage form as extended-release oral tablets, and a package size of 100 tablets. It advises once-daily use and swallowing whole, with manufacturer Cadila Healthcare Ltd., India, and distributor Zydus Pharmaceuticals USA Inc.*
FDA Label Image

Mirabegron Extended-release Tablets, 50mg (Fe06b979 134e 4ba2 9f86 Ab442a3562a1 11)

Mirabegron Extended-release Tablets, 50mg (Fe06b979 134e 4ba2 9f86 Ab442a3562a1 11)
Mirabegron Extended-Release Tablets 50 mg, oral, once-daily dosage form. The label shows a bottle containing 100 tablets, manufactured by Cadila Healthcare Ltd., and distributed by Zydus Pharmaceuticals USA Inc. Instructions include swallowing the tablet whole without cutting or crushing and storage at controlled room temperature.*

* About these descriptions: Image descriptions on this page are generated by automated AI analysis of the product label images from the manufacturer's FDA label submission (SPL). They are provided for reference only and may contain errors or omissions. Always rely on the printed label itself and the official FDA labeling, and consult a pharmacist or healthcare professional with any questions about this product.