Bosentan Tablet, For Suspension
Product Images NDC 70710-1508

View Photos of Packaging, Regulatory Labels, and Product Appearance

Product Visual Gallery

This gallery contains 10 technical images submitted to the FDA as part of the official labeling for Bosentan (NDC 70710-1508). Unlike standard consumer photos, these assets often include clinical data figures, molecular chemical structures, and official manufacturer packaging layouts.

As provided by Zydus Pharmaceuticals Usa Inc., these visuals offer a comprehensive scientific overview of the product's physical and chemical identity, aiding pharmacists and researchers in product verification and study.

FDA Label Image

Image (A4b3663e 948c 4d0d 9916 237b5597ad9f 01)

Image (A4b3663e 948c 4d0d 9916 237b5597ad9f 01)
A table depicting interacting drugs with bosentan, listing Cyclosporin A, Glyburide, Simvastatin, ß-Hydroxy acid simvastatin, Norethindrone, and Ethinyl estradiol. It includes pharmacokinetic parameters (Cmax and AUC) with fold-change data and provides corresponding clinical recommendations such as contraindication, monitoring cholesterol, or using additional contraception.*
FDA Label Image

Image (A4b3663e 948c 4d0d 9916 237b5597ad9f 02)

Image (A4b3663e 948c 4d0d 9916 237b5597ad9f 02)
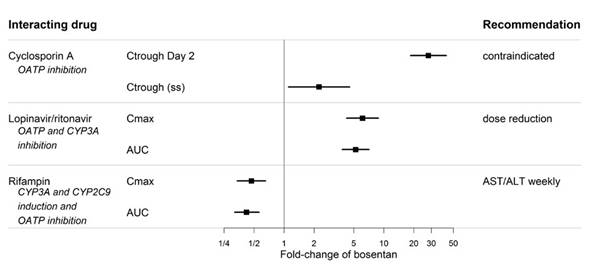
A chart showing fold-change in bosentan levels due to interacting drugs including Cyclosporin A, Lopinavir/ritonavir, and Rifampin. The X-axis represents fold-change in bosentan concentration, with data points and recommendations listed, including contraindication, dose reduction, and AST/ALT monitoring guidance.*
FDA Label Image

Image (A4b3663e 948c 4d0d 9916 237b5597ad9f 03)

Image (A4b3663e 948c 4d0d 9916 237b5597ad9f 03)
Chemical structure diagram of bosentan monohydrate showing its molecular composition including aromatic rings, nitrogen, oxygen, sulfur groups, and a water molecule (H2O). This structure illustrates the arrangement of atoms and bonds characteristic of bosentan.*
FDA Label Image

Image (A4b3663e 948c 4d0d 9916 237b5597ad9f 04)

Image (A4b3663e 948c 4d0d 9916 237b5597ad9f 04)
A data table illustrating drug interaction effects for various interacting drugs with respect to bosentan. The table shows fold-change values for Cmax and AUC parameters alongside clinical recommendations, including contraindications, monitoring cholesterol, no adjustment, and use of additional contraception. A fold-change scale is shown at the bottom of the table.*
FDA Label Image

Image (A4b3663e 948c 4d0d 9916 237b5597ad9f 05)

Image (A4b3663e 948c 4d0d 9916 237b5597ad9f 05)
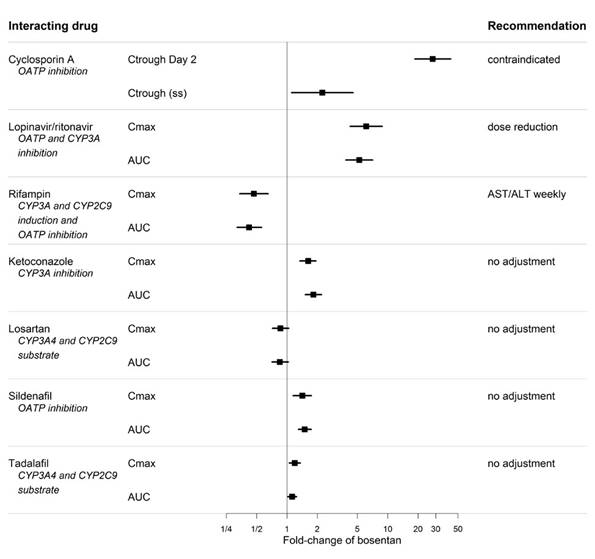
A chart showing the fold-change of bosentan concentration with various interacting drugs, indicating pharmacokinetic effects at Cmax and AUC levels. The chart includes drugs like Cyclosporin A, Lopinavir/ritonavir, Rifampin, Ketoconazole, Losartan, Sildenafil, and Tadalafil, with recommendations ranging from contraindication, dose reduction, weekly AST/ALT monitoring, to no adjustment needed. The x-axis shows the fold-change of bosentan on a logarithmic scale.*
FDA Label Image

Image (A4b3663e 948c 4d0d 9916 237b5597ad9f 06)

Image (A4b3663e 948c 4d0d 9916 237b5597ad9f 06)
A line graph comparing distance in meters over 16 weeks between two groups: one treated with bosentan (n=144) and a placebo group (n=69). The bosentan group shows an increase in distance up to week 8, maintaining higher values through week 16, while the placebo group shows a slight increase at week 4 followed by a decline to below baseline by week 16.*
FDA Label Image

Image (A4b3663e 948c 4d0d 9916 237b5597ad9f 07)

Image (A4b3663e 948c 4d0d 9916 237b5597ad9f 07)
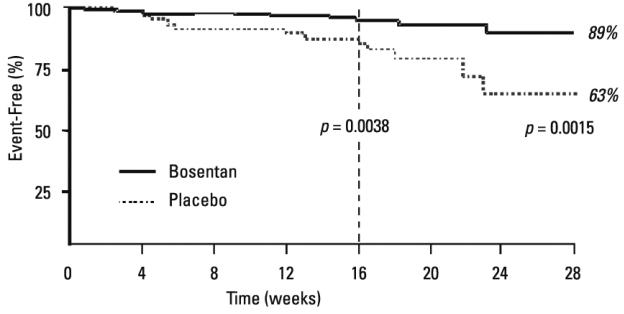
A Kaplan-Meier curve comparing event-free percentages over time (weeks) between bosentan and placebo groups. The graph shows higher event-free survival for bosentan at 28 weeks (89%) compared to placebo (63%), with p-values indicating statistical significance at specific time points.*
FDA Label Image

Image (A4b3663e 948c 4d0d 9916 237b5597ad9f 08)

Image (A4b3663e 948c 4d0d 9916 237b5597ad9f 08)
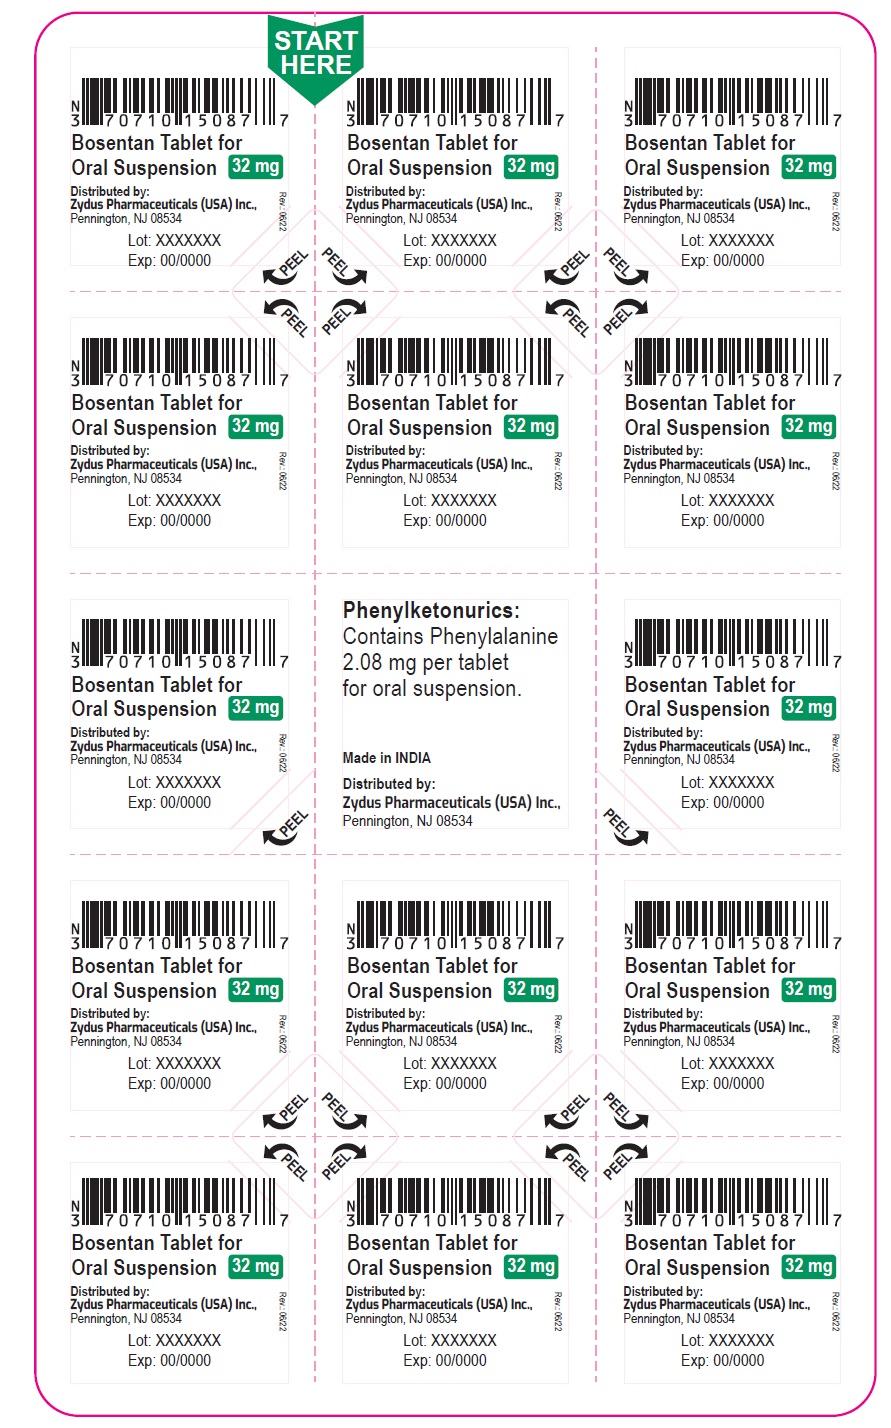
Bosentan Tablet for Oral Suspension 32 mg label sheet distributed by Zydus Pharmaceuticals (USA) Inc., Pennington, NJ. The sheet includes multiple identical labels each showing the product name, strength 32 mg, barcodes, lot and expiration date placeholders, and a central label with phenylketonurics warning for phenylalanine content. The labels have peel indicators and a start here arrow.*
FDA Label Image

Image (A4b3663e 948c 4d0d 9916 237b5597ad9f 09)

Image (A4b3663e 948c 4d0d 9916 237b5597ad9f 09)
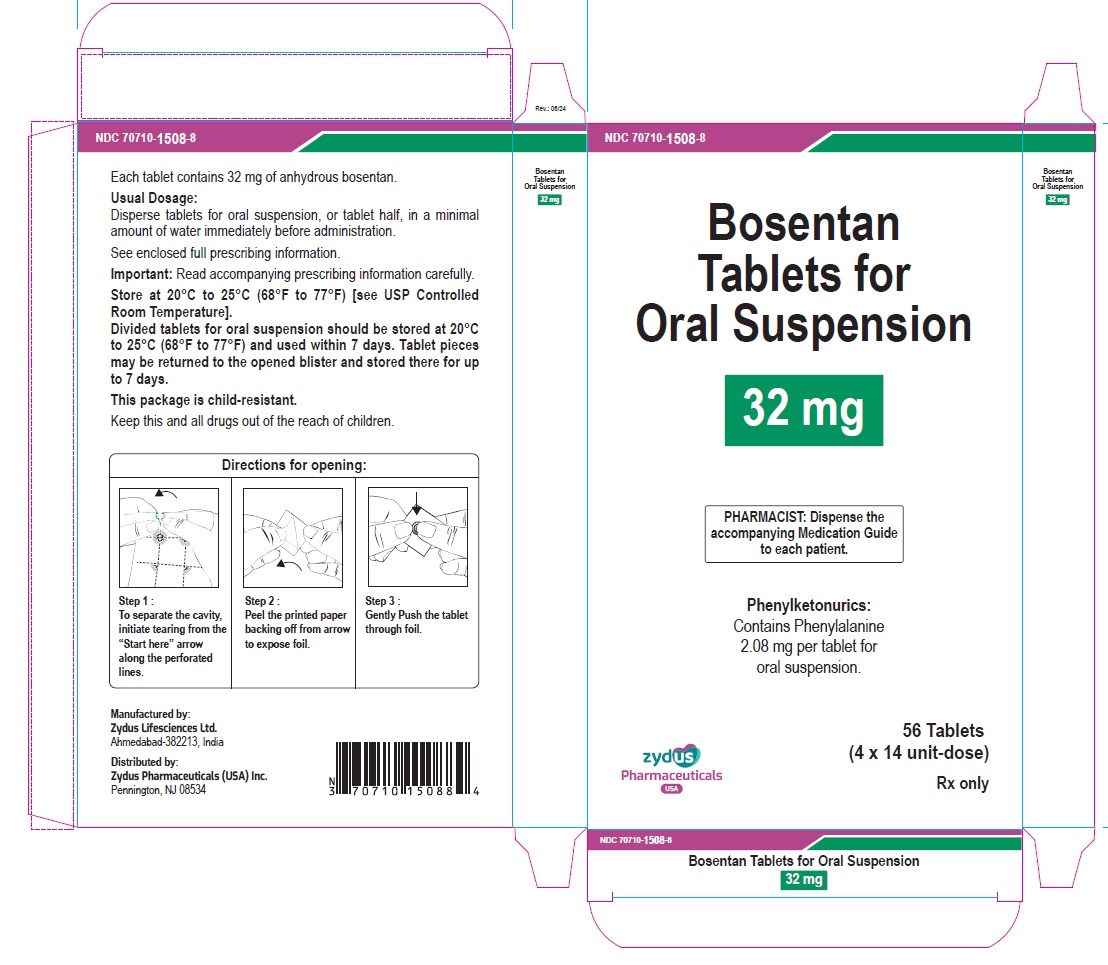
Box packaging label for Bosentan Tablets for Oral Suspension 32 mg by Zydus Pharmaceuticals USA Inc. Contains 56 tablets in 4 blister packs of 14 unit-dose tablets each. Front panel includes dosage strength, instructions for pharmacists, and phenylalanine content warning. Side panel shows usage directions, storage instructions, child-resistant packaging note, and manufacturer details along with a barcode.*
FDA Label Image

Image (A4b3663e 948c 4d0d 9916 237b5597ad9f 188 2)

Image (A4b3663e 948c 4d0d 9916 237b5597ad9f 188 2)
An instructional diagram showing a rectangular shape with a notch on its top side and two curved arrows pointing downward from both ends of the rectangle, suggesting a folding or opening motion.*

* About these descriptions: Image descriptions on this page are generated by automated AI analysis of the product label images from the manufacturer's FDA label submission (SPL). They are provided for reference only and may contain errors or omissions. Always rely on the printed label itself and the official FDA labeling, and consult a pharmacist or healthcare professional with any questions about this product.