Fulvestrant Injection, Solution
Product Images NDC 70710-1688
View Photos of Packaging, Regulatory Labels, and Product Appearance
Product Visual Gallery
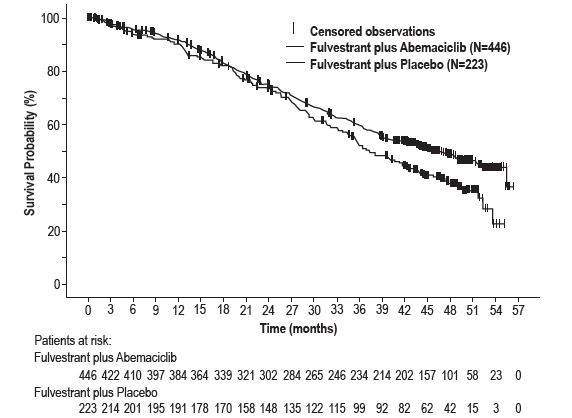
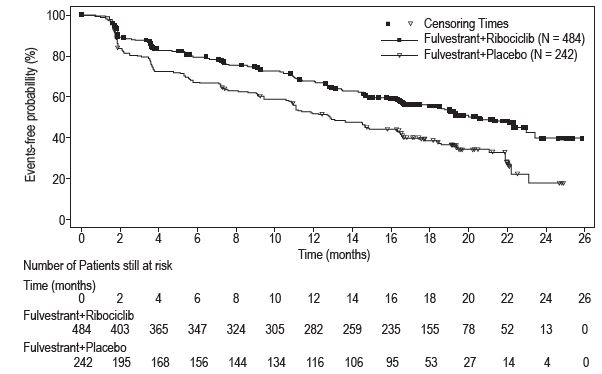
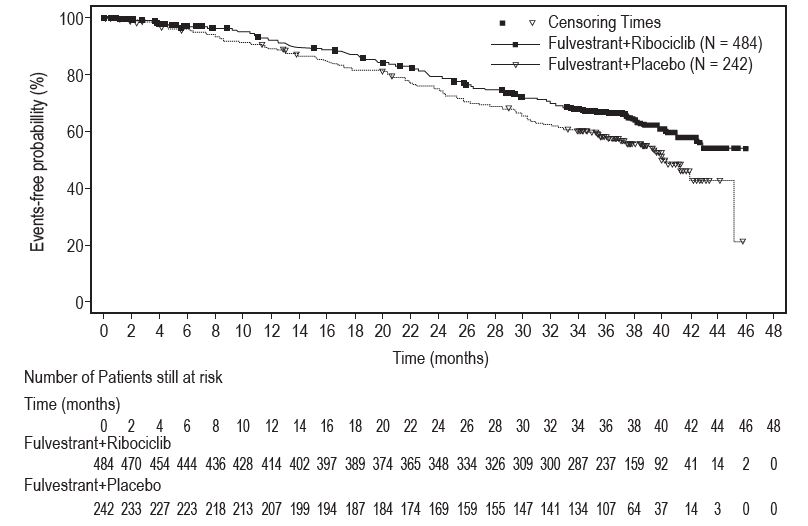
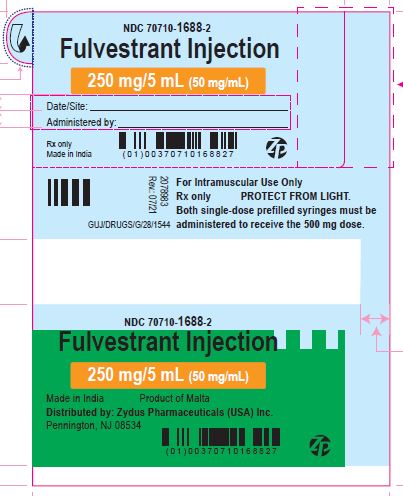
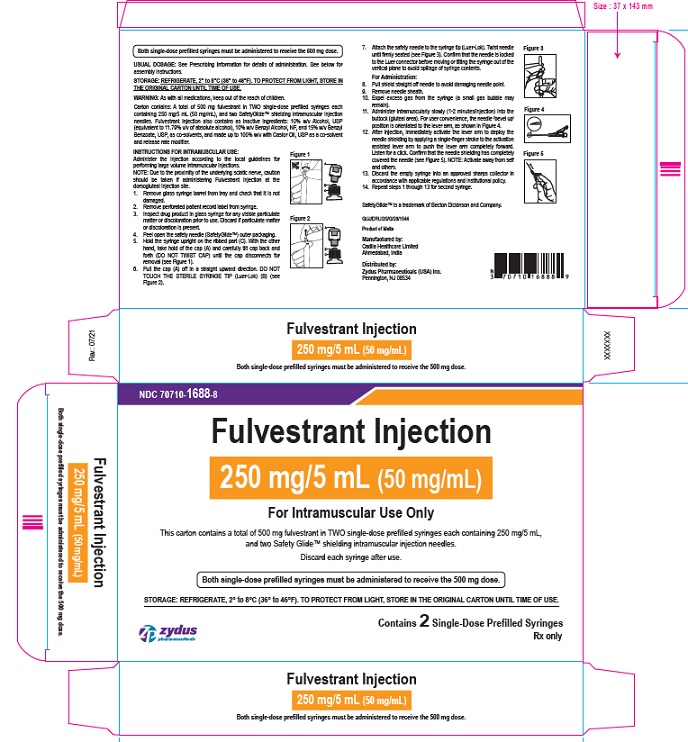
This gallery contains 17 technical images submitted to the FDA as part of the official labeling for Fulvestrant (NDC 70710-1688). Unlike standard consumer photos, these assets often include clinical data figures, molecular chemical structures, and official manufacturer packaging layouts.
As provided by Zydus Pharmaceuticals Usa Inc., these visuals offer a comprehensive scientific overview of the product's physical and chemical identity, aiding pharmacists and researchers in product verification and study.
Product Images & Figures Index
Image (297c22a2 0a7d 4b35 9f11 31a7c75501b8 02)
Image (297c22a2 0a7d 4b35 9f11 31a7c75501b8 03)
Image (297c22a2 0a7d 4b35 9f11 31a7c75501b8 04)
Image (297c22a2 0a7d 4b35 9f11 31a7c75501b8 05)
Image (297c22a2 0a7d 4b35 9f11 31a7c75501b8 06)
Image (297c22a2 0a7d 4b35 9f11 31a7c75501b8 07)
Image (297c22a2 0a7d 4b35 9f11 31a7c75501b8 08)
The text is presenting data on the survival rate of patients who were treated with Fulvestrant. The data is separated based on whether the patients were treated with Fulvestrant at 500 mg or 250 mg. The presentation of the data is in the form of a graph, with the x-axis measuring time (in months) and the y-axis measuring the proportion of patients who were alive. The data indicates that the survival rate of patients was not significantly affected by the dose of Fulvestrant administered. The text mentions that there were no adjustments made for multiplicity during the study.*
Image (297c22a2 0a7d 4b35 9f11 31a7c75501b8 09)
Image (297c22a2 0a7d 4b35 9f11 31a7c75501b8 10)
Image (297c22a2 0a7d 4b35 9f11 31a7c75501b8 11)
This is a survival probability graph for patients treated with Fulvestrant and Palbociclib versus placebo. The X-axis represents the length of time in months from the start of treatment, while the Y-axis shows the probability of overall survival. The number of patients at risk is also displayed at different time points.*
Image (297c22a2 0a7d 4b35 9f11 31a7c75501b8 12)
This appears to be a table of data related to a clinical study evaluating the progression-free survival probability of two treatment groups (one group received fulvestrant plus abemaciclib and another group received fulvestrant plus placebo). The table includes information on the number of patients in each group (446 vs 223), censored observations, and patients at risk over different time periods (measured in months). It is not possible to tell what the study was aiming to treat or the results of the study from this table alone.*
Image (297c22a2 0a7d 4b35 9f11 31a7c75501b8 13)
The provided text appears to be a graph that displays the survival probability of two different treatments given to patients. On the graph, there are two lines, one for "Fulvestrant plus Abemaciclib" and the other for "Fulvestrant plus Placebo". The x-axis displays the time in months and the y-axis displays the survival probability as a percentage. The graph shows data for up to 57 months of treatment and displays the number of patients at risk at each timepoint for each of the treatments.*
Image (297c22a2 0a7d 4b35 9f11 31a7c75501b8 14)
This is a graph or diagram plotting time (months) and the effect of Fulvestrant+Ribociclib versus Fulvestrant+Placebo on patients. The number of patients at risk and events-ree probability (%) are also shown. However, without more context or clarification, it is not clear what these numbers represent or what the significance of the differences between the two groups is.*
Image (297c22a2 0a7d 4b35 9f11 31a7c75501b8 15)
Pfs Label (297c22a2 0a7d 4b35 9f11 31a7c75501b8 16)
Carton Label (297c22a2 0a7d 4b35 9f11 31a7c75501b8 17)
* These product label images have been analyzed using experimental machine learning. Please verify findings with the primary label text.