Nufymco Injection, Solution
Product Images NDC 70710-2173

View Photos of Packaging, Regulatory Labels, and Product Appearance

Product Visual Gallery

This gallery contains 16 technical images submitted to the FDA as part of the official labeling for Nufymco (NDC 70710-2173). Unlike standard consumer photos, these assets often include clinical data figures, molecular chemical structures, and official manufacturer packaging layouts.

As provided by Zydus Pharmaceuticals Usa Inc., these visuals offer a comprehensive scientific overview of the product's physical and chemical identity, aiding pharmacists and researchers in product verification and study.

FDA Label Image

Image (4a45dd5a C8d9 4e98 9586 Ab6c069c2ffe 01)
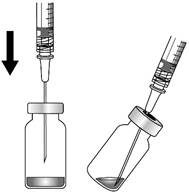
Image (4a45dd5a C8d9 4e98 9586 Ab6c069c2ffe 01)
An instructional illustration showing how to draw medication from a vial into a syringe. The two-step diagram depicts inserting the needle straight down into an upright vial and then withdrawing liquid from a vial held at an angle.*
FDA Label Image

Image (4a45dd5a C8d9 4e98 9586 Ab6c069c2ffe 02)

Image (4a45dd5a C8d9 4e98 9586 Ab6c069c2ffe 02)
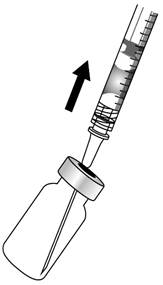
An instructional diagram showing a syringe drawing liquid from a vial. The syringe is partially filled, and an arrow points upward indicating the direction to pull the syringe plunger to withdraw the solution.*
FDA Label Image

Image (4a45dd5a C8d9 4e98 9586 Ab6c069c2ffe 03)

Image (4a45dd5a C8d9 4e98 9586 Ab6c069c2ffe 03)
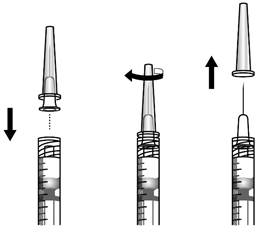
An instructional diagram showing three steps to remove a needle cap from a syringe: pulling the cap straight down, twisting it, and then pulling it straight up off the syringe barrel. The syringe is depicted with volume markings and a plunger.*
FDA Label Image

Image (4a45dd5a C8d9 4e98 9586 Ab6c069c2ffe 04)

Image (4a45dd5a C8d9 4e98 9586 Ab6c069c2ffe 04)
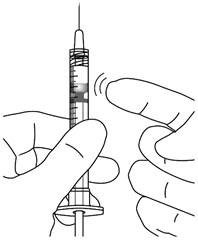
A black-and-white illustration showing a hand holding a syringe containing an injectable solution. The image depicts the action of expelling air bubbles from the syringe by flicking it with a finger, a common preparation step for intravitreal injections.*
FDA Label Image

Image (4a45dd5a C8d9 4e98 9586 Ab6c069c2ffe 05)

Image (4a45dd5a C8d9 4e98 9586 Ab6c069c2ffe 05)
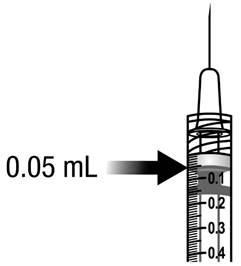
An illustration showing an intravitreal injection syringe filled with a liquid dosage. An arrow points to the 0.05 mL volume mark on the syringe, indicating the specific dose volume to be administered.*
FDA Label Image

Image (4a45dd5a C8d9 4e98 9586 Ab6c069c2ffe 06)

Image (4a45dd5a C8d9 4e98 9586 Ab6c069c2ffe 06)
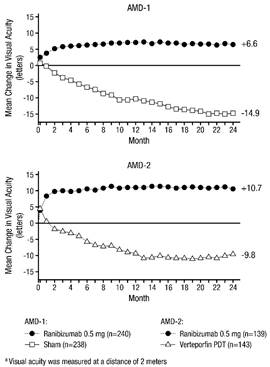
Two line graphs labeled AMD-1 and AMD-2 showing mean change in visual acuity (letters read) over 24 months. Both graphs compare ranibizumab 0.5 mg (represented by solid circles) with sham or verteporfin PDT (open squares or triangles). The Y-axis indicates letters gained or lost; the X-axis shows time in months.*
FDA Label Image

Image (4a45dd5a C8d9 4e98 9586 Ab6c069c2ffe 07)

Image (4a45dd5a C8d9 4e98 9586 Ab6c069c2ffe 07)
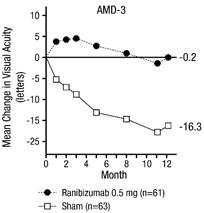
A line graph comparing the mean change in visual acuity over 12 months between ranibizumab 0.5 mg and sham groups in a study labeled AMD-3. The vertical axis shows mean change in letters, and the horizontal axis shows time in months.*
FDA Label Image

Image (4a45dd5a C8d9 4e98 9586 Ab6c069c2ffe 08)

Image (4a45dd5a C8d9 4e98 9586 Ab6c069c2ffe 08)
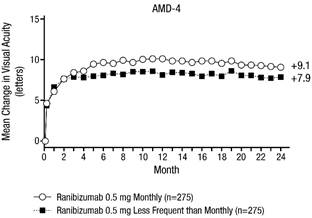
A line graph titled AMD-4 showing mean change in visual acuity over a 24-month period for ranibizumab 0.5 mg injected monthly versus less frequently than monthly. The y-axis shows mean change in letters, and the x-axis shows time in months. Two data series are plotted, with monthly dosing showing a slightly higher mean improvement.*
FDA Label Image

Image (4a45dd5a C8d9 4e98 9586 Ab6c069c2ffe 09)

Image (4a45dd5a C8d9 4e98 9586 Ab6c069c2ffe 09)
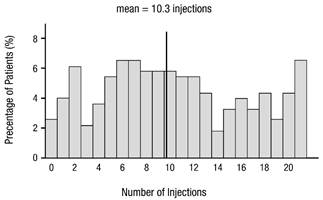
A bar chart depicting the percentage of patients versus the number of injections, ranging from 0 to 21 injections. The graph includes a vertical line indicating the mean number of injections at 10.3. The y-axis shows the percentage of patients, reaching up to about 8%.*
FDA Label Image

Image (4a45dd5a C8d9 4e98 9586 Ab6c069c2ffe 10)

Image (4a45dd5a C8d9 4e98 9586 Ab6c069c2ffe 10)
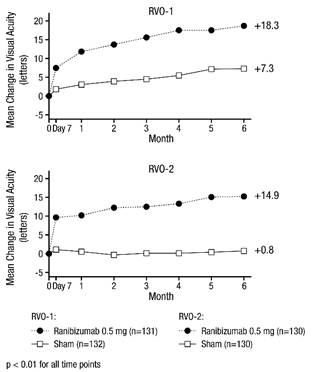
Two line graphs titled RV0-1 and RV0-2 showing mean change in visual acuity (letters) over 6 months. Each graph compares ranibizumab 0.5 mg to a sham treatment, with ranibizumab demonstrating a greater increase in letters read at each time point.*
FDA Label Image

Image (4a45dd5a C8d9 4e98 9586 Ab6c069c2ffe 11)

Image (4a45dd5a C8d9 4e98 9586 Ab6c069c2ffe 11)
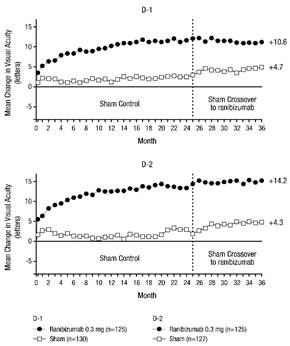
Two line graphs showing mean changes in visual acuity over 36 months. The first graph compares ranibizumab 0.3 mg with a sham control, with a crossover to ranibizumab at month 24. The second graph compares ranibizumab 0.5 mg with a sham control, also crossing over at month 24. Both graphs display improvements in visual acuity for ranibizumab groups compared to sham controls.*
FDA Label Image

Image (4a45dd5a C8d9 4e98 9586 Ab6c069c2ffe 12)

Image (4a45dd5a C8d9 4e98 9586 Ab6c069c2ffe 12)
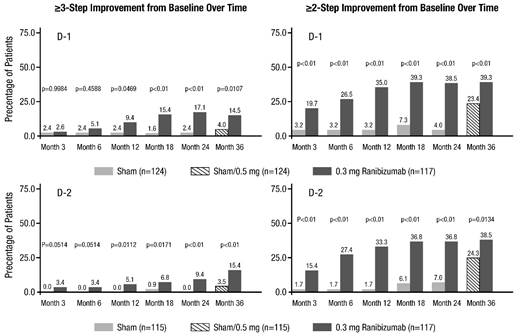
Two sets of bar charts depicting the percentage of patients with ≥3-step and ≥2-step improvement from baseline over various time points up to Month 36. The data compares different treatment groups, including sham, Sham/0.5 mg, and 0.3 mg Ranibizumab, across time intervals at Months 3, 6, 12, 18, 24, and 36.*
FDA Label Image

Image (4a45dd5a C8d9 4e98 9586 Ab6c069c2ffe 13)

Image (4a45dd5a C8d9 4e98 9586 Ab6c069c2ffe 13)
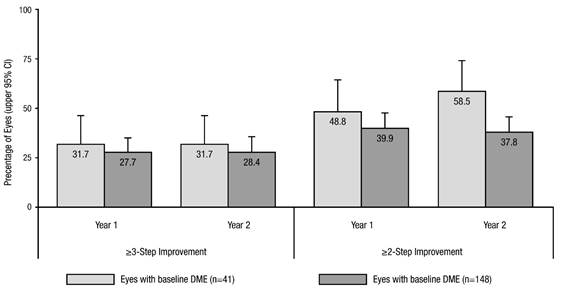
Bar chart showing percentage of eyes with 2-step and 3-step improvement over two years, comparing eyes with baseline diabetic macular edema (DME) across two different sample sizes (41 and 148). The graph illustrates improvement trends from year 1 to year 2 with error bars indicating variability.*
FDA Label Image

Image (4a45dd5a C8d9 4e98 9586 Ab6c069c2ffe 14)

Image (4a45dd5a C8d9 4e98 9586 Ab6c069c2ffe 14)
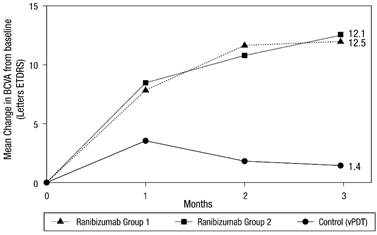
A line graph showing mean change in central subfield thickness (CST) from baseline over a period of 3 months. The graph compares two ranibizumab groups and a control group (vPDT), with data points at baseline, 1 month, 2 months, and 3 months. The ranibizumab groups show increasing CST changes over time, while the control group remains relatively flat.*
FDA Label Image

Ranibizumab-leyk Injection, 0.3 mg (0.05 mL Of 6 mg/ml Solution) (4a45dd5a C8d9 4e98 9586 Ab6c069c2ffe 15)

Ranibizumab-leyk Injection, 0.3 mg (0.05 mL Of 6 mg/ml Solution) (4a45dd5a C8d9 4e98 9586 Ab6c069c2ffe 15)
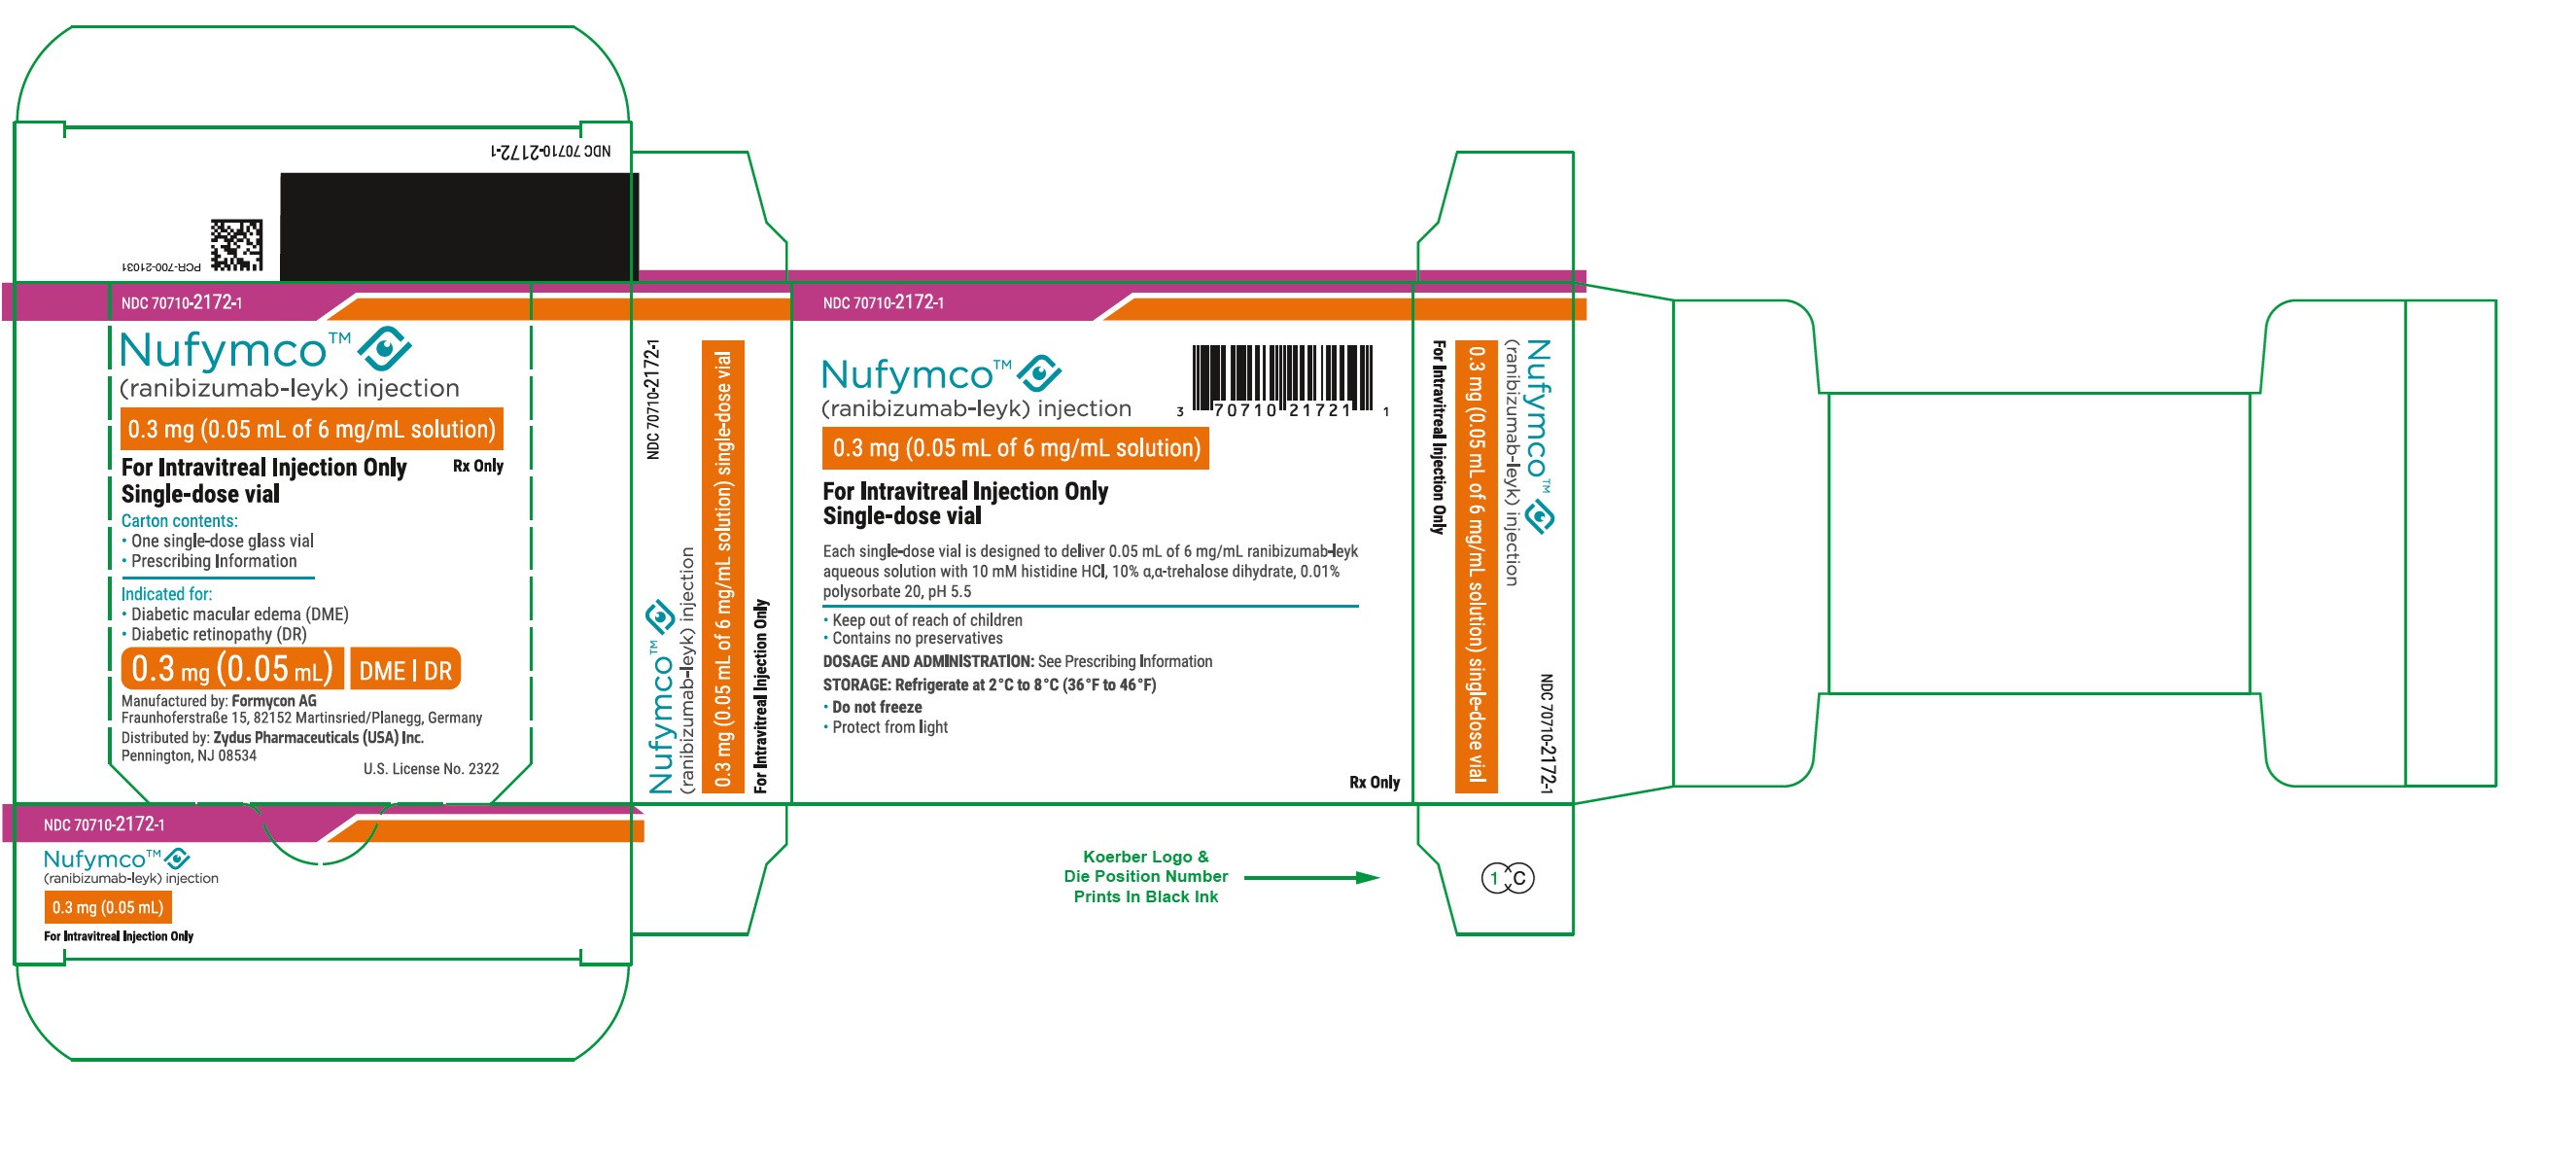
Packaging label for NUFYMCO (ranibizumab-leyk) injection, 0.3 mg (0.05 mL of 6 mg/mL solution) intravitreal injection by Zydus Pharmaceuticals USA Inc. The label indicates it is a single-dose vial for intravitreal injection only. The carton includes prescribing information and storage instructions, specifying refrigeration at 2°C to 8°C and protection from light.*
FDA Label Image

Ranibizumab-leyk Injection, 0.5 mg (0.05 mL Of 10 mg/ml Solution) (4a45dd5a C8d9 4e98 9586 Ab6c069c2ffe 16)

Ranibizumab-leyk Injection, 0.5 mg (0.05 mL Of 10 mg/ml Solution) (4a45dd5a C8d9 4e98 9586 Ab6c069c2ffe 16)
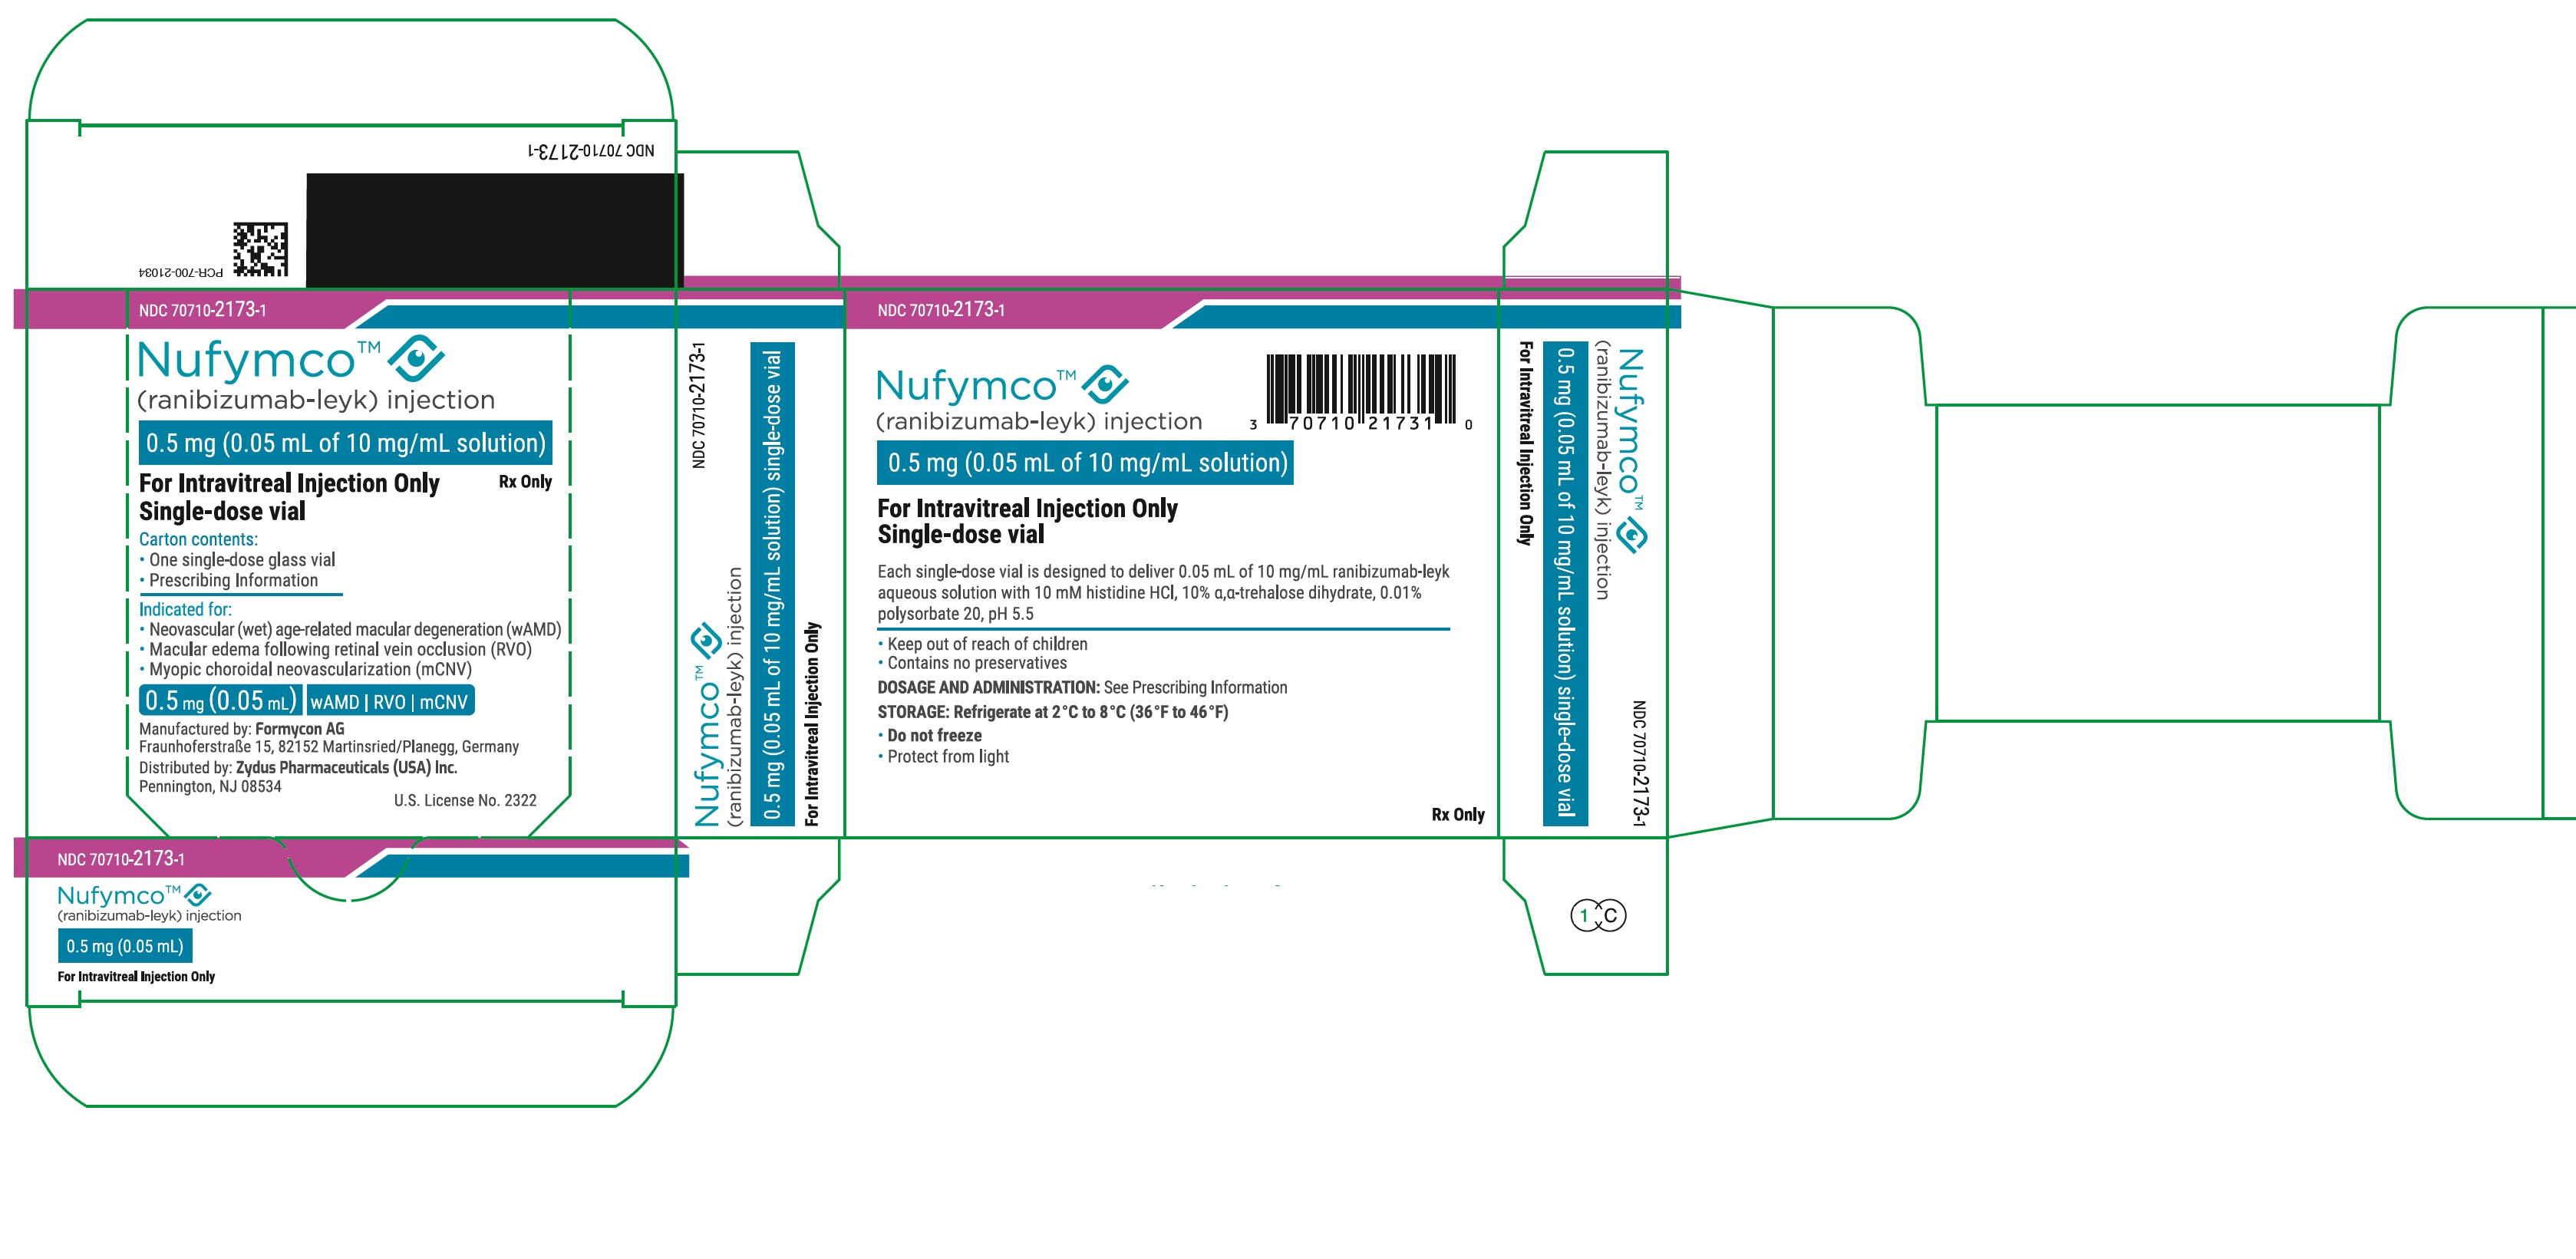
Nufymco (ranibizumab-leyk) injection 0.5 mg (0.05 mL of 10 mg/mL solution) single-dose vial carton from Zydus Pharmaceuticals USA Inc. The packaging indicates use for intravitreal injection only. It includes prescribing information and states formulation details such as 0.05 mL of 10 mg/mL ranibizumab-leyk aqueous solution with specified excipients, storage instructions, and usage warnings.*

* About these descriptions: Image descriptions on this page are generated by automated AI analysis of the product label images from the manufacturer's FDA label submission (SPL). They are provided for reference only and may contain errors or omissions. Always rely on the printed label itself and the official FDA labeling, and consult a pharmacist or healthcare professional with any questions about this product.