Rhopressa Solution/ Drops
Product Images NDC 70727-497

9 FDA label images from Alcon Laboratories, Inc. · Packaging, Regulatory Labels, and Product Appearance

Product Visual Gallery

This gallery contains 9 technical images submitted to the FDA as part of the official labeling for Rhopressa (NDC 70727-497). Unlike standard consumer photos, these assets often include clinical data figures, molecular chemical structures, and official manufacturer packaging layouts.

As provided by Alcon Laboratories, Inc., these visuals offer a comprehensive scientific overview of the product's physical and chemical identity, aiding pharmacists and researchers in product verification and study.

FDA Label Image

Study 301: Subjects With Baseline Iop < 25 Mmhg (Image 01)

Study 301:  Subjects With Baseline Iop < 25 Mmhg (Image 01)
A table and accompanying forest plot from Study 301 showing mean intraocular pressure (IOP) values and changes from baseline at various time points (8am, 10am, 4pm) for subjects with baseline IOP less than 25 mmHg. The data compares Rhopressa (netarsudil ophthalmic solution 0.2 mg/mL) versus Timolol, with mean IOP and change from baseline presented for Day 15, Day 43, and Day 90 visits, along with the difference between Rhopressa and Timolol including 95% confidence intervals.*
FDA Label Image

Study 301: Subjects With Baseline Iop >= 25 And < 27 Mmhg (Image 02)

Study 301:  Subjects With Baseline Iop >= 25 And < 27 Mmhg (Image 02)
A horizontal dot plot chart comparing intraocular pressure (IOP) changes from baseline at different times (8am, 10am, 4pm) across Days 15, 43, and 90 in a study of subjects with baseline IOP between 25 and 27 mmHg. It compares Rhopressa (netarsudil) versus Timolol, showing mean differences and 95% confidence intervals at each time point. The data is tabulated alongside the graph, detailing IOP measurements for each treatment group and visit time.*
FDA Label Image

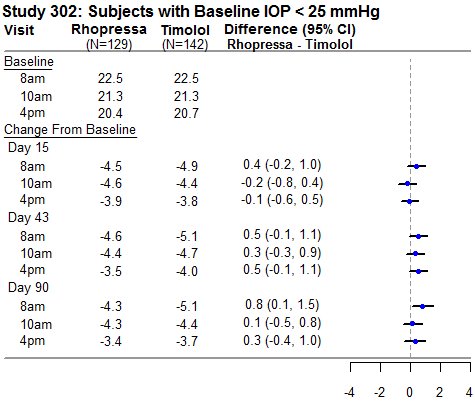
Study 302: Subjects With Baseline Iop < 25 Mmhg (Image 03)

Study 302: Subjects With Baseline Iop < 25 Mmhg (Image 03)
A data table and forest plot from a clinical study comparing intraocular pressure (IOP) changes over time at 8am, 10am, and 4pm visits for Rhopressa (netarsudil) and Timolol in subjects with baseline IOP less than 25 mmHg. The table shows mean IOP values at baseline and changes from baseline on Days 15, 43, and 90, alongside the difference (with 95% confidence intervals) between Rhopressa and Timolol at each time point. The plot visually represents these differences with markers and confidence intervals around zero.*
FDA Label Image

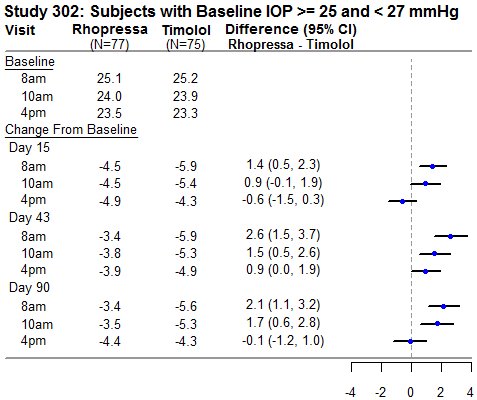
Study 302: Subjects With Baseline Iop >= 25 And < 27 Mmhg (Image 04)

Study 302: Subjects With Baseline Iop >= 25 And < 27 Mmhg (Image 04)
A forest plot chart comparing intraocular pressure (IOP) changes from baseline between Rhopressa (netarsudil) and Timolol at different visits and times of day (8am, 10am, 4pm). The chart includes mean differences with 95% confidence intervals, showing study data over baseline, Day 15, Day 43, and Day 90 for subjects with baseline IOP between 25 and 27 mmHg.*
FDA Label Image

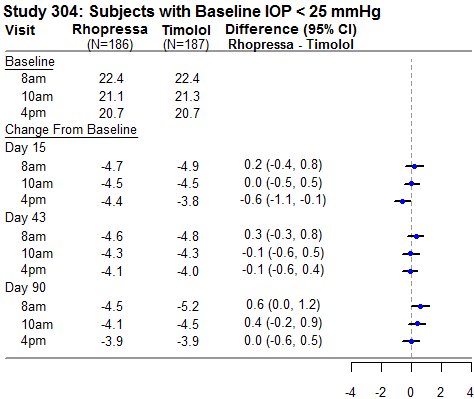
Study 304: Subjects With Baseline Iop < 25 Mmhg (Image 05)

Study 304: Subjects With Baseline Iop < 25 Mmhg (Image 05)
A clinical study results chart comparing the effects of Rhopressa (netarsudil ophthalmic solution 0.2 mg/mL) and Timolol on intraocular pressure (IOP) in subjects with baseline IOP less than 25 mmHg. The chart presents mean IOP values at various times (8am, 10am, 4pm) across baseline, day 15, day 43, and day 90 visits, along with differences between treatments and 95% confidence intervals shown as horizontal error bars.*
FDA Label Image

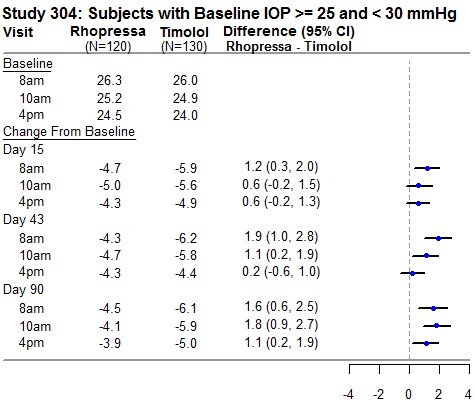
Study 304: Subjects With Baseline Iop >= 25 And < 30 Mmhg (Image 06)

Study 304: Subjects With Baseline Iop >= 25 And < 30 Mmhg (Image 06)
A data table with a corresponding forest plot showing intraocular pressure (IOP) measurements and changes from baseline for subjects treated with Rhopressa (netarsudil ophthalmic solution) versus Timolol. The table lists baseline IOP values at 8am, 10am, and 4pm, and changes from baseline at Days 15, 43, and 90. The forest plot visualizes the difference in IOP change between Rhopressa and Timolol with 95% confidence intervals at various time points.*
FDA Label Image

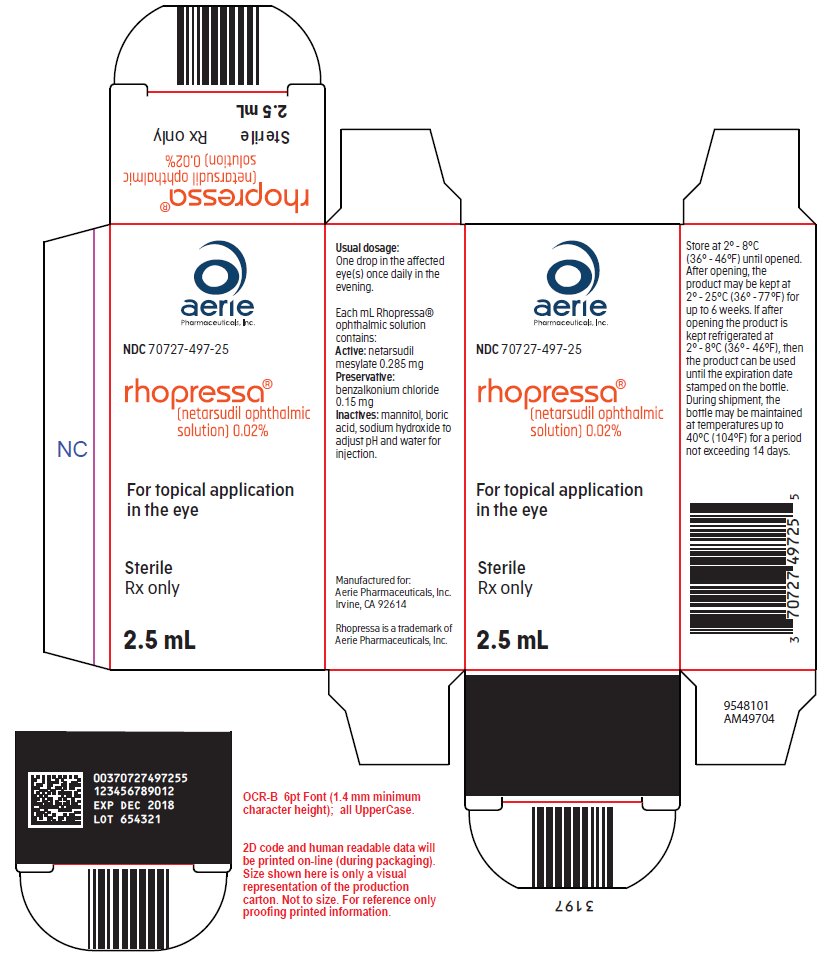
Rhopressa (netarsudil Ophthalmic Solution) 0.02% Sample Label (Image 07)

Rhopressa (netarsudil Ophthalmic Solution) 0.02% Sample Label (Image 07)
Carton packaging label for Rhopressa (netarsudil ophthalmic solution) 0.02% sterile eye drops, 2.5 mL. The label includes dosage and storage instructions, manufacturer information for Aerie Pharmaceuticals, Inc., and multiple barcodes. It states the product is for topical ophthalmic use, Rx only.*
FDA Label Image

Image 08

Image 08
Rhopressa (netarsudil ophthalmic solution) 0.02% sterile eye drops packaging label. Each 2.5 mL sample bottle contains netarsudil mesylate 0.285 mg per mL. The label identifies it for topical ophthalmic use, prescription only, and includes storage instructions and manufacturer information for Aerie Pharmaceuticals, Inc.*
FDA Label Image

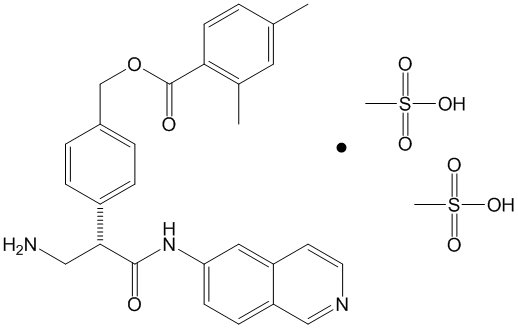
Netarsudil Structural Formula (Molecule)

Netarsudil Structural Formula (Molecule)
Chemical structure diagram of netarsudil, the active ingredient in Rhopressa ophthalmic solution. The structure includes the netarsudil molecule with surrounding molecular groups depicted.*

* About these descriptions: Image descriptions on this page are generated by automated AI analysis of the product label images from the manufacturer's FDA label submission (SPL). They are provided for reference only and may contain errors or omissions. Always rely on the printed label itself and the official FDA labeling, and consult a pharmacist or healthcare professional with any questions about this product.