Dapagliflozin And Metformin Hydrochloride Tablet, Extended Release
Product Images NDC 70748-101

View Photos of Packaging, Regulatory Labels, and Product Appearance

Product Visual Gallery

This gallery contains 17 technical images submitted to the FDA as part of the official labeling for Dapagliflozin And Metformin Hydrochloride (NDC 70748-101). Unlike standard consumer photos, these assets often include clinical data figures, molecular chemical structures, and official manufacturer packaging layouts.

As provided by Lupin Pharmaceuticals, Inc., these visuals offer a comprehensive scientific overview of the product's physical and chemical identity, aiding pharmacists and researchers in product verification and study.

FDA Label Image

Image 01 (Ebd84428 E4bd 415b Af5d 5832506b0e38 01)
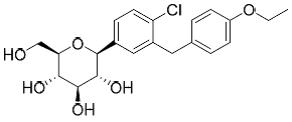
Image 01 (Ebd84428 E4bd 415b Af5d 5832506b0e38 01)
Chemical structure diagram of Dapagliflozin, one of the active ingredients in Dapagliflozin and Metformin Hydrochloride tablets extended release by Lupin Pharmaceuticals, Inc.*
FDA Label Image

Image 02 (Ebd84428 E4bd 415b Af5d 5832506b0e38 02)

Image 02 (Ebd84428 E4bd 415b Af5d 5832506b0e38 02)
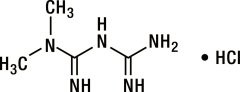
Chemical structure of dapagliflozin and metformin hydrochloride, showing the molecular arrangement and atoms including nitrogen, carbon, hydrogen, and hydrochloride component.*
FDA Label Image

03 (Ebd84428 E4bd 415b Af5d 5832506b0e38 03)

03 (Ebd84428 E4bd 415b Af5d 5832506b0e38 03)
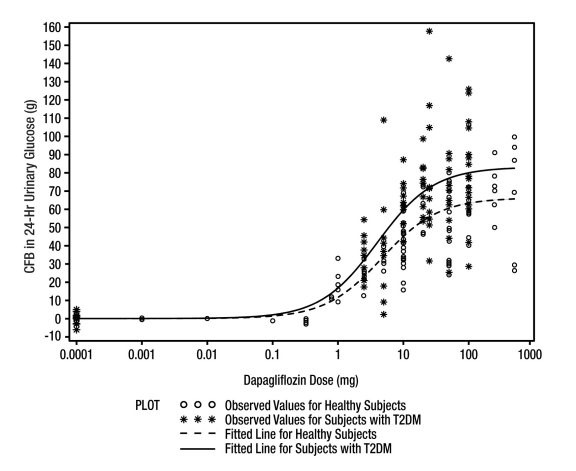
A scatter plot with dose-response curves showing dapagliflozin dose (mg) on the x-axis (log scale) versus change from baseline (CFB) in 24-hour urinary glucose (g) on the y-axis. The graph includes observed values and fitted lines for both healthy subjects and subjects with type 2 diabetes mellitus (T2DM).*
FDA Label Image

Image 04 (Ebd84428 E4bd 415b Af5d 5832506b0e38 04)

Image 04 (Ebd84428 E4bd 415b Af5d 5832506b0e38 04)
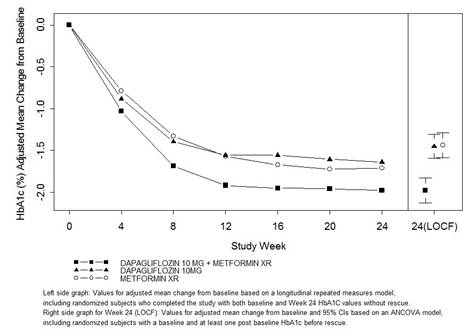
A line graph illustrating the adjusted mean change from baseline in HbA1c (%) over 24 weeks for three groups: Dapagliflozin 10 mg + Metformin XR, Dapagliflozin 10 mg alone, and Metformin XR alone. The x-axis shows study weeks from 0 to 24, and the y-axis shows HbA1c change from baseline. The graph includes a legend and notes on statistical analysis.*
FDA Label Image

Figure 3 (Ebd84428 E4bd 415b Af5d 5832506b0e38 05)

Figure 3 (Ebd84428 E4bd 415b Af5d 5832506b0e38 05)
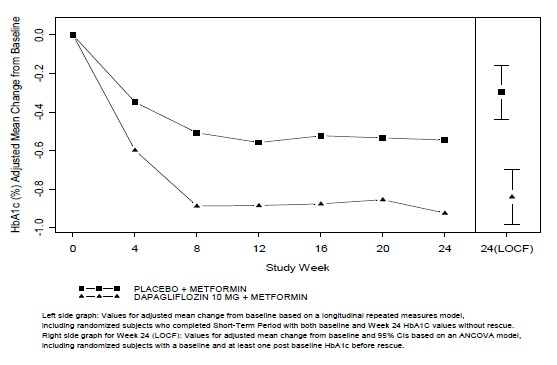
A line graph showing HbA1c (%) adjusted mean change from baseline over 24 weeks comparing Placebo + Metformin and Dapagliflozin 10 mg + Metformin. The graph includes a study week timeline on the x-axis and HbA1c change on the y-axis, with error bars displayed for Week 24 (LOCF) data.*
FDA Label Image

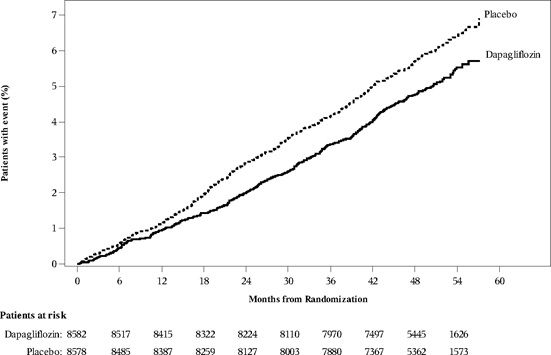
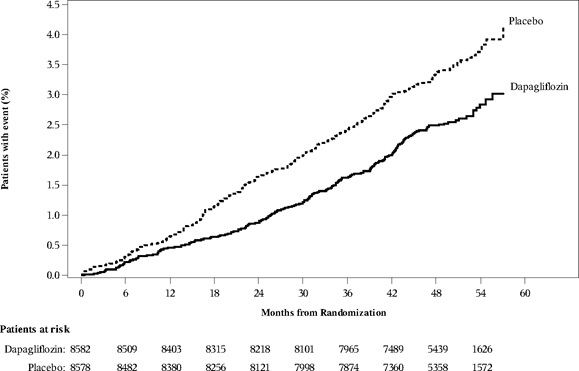
Figure 4: Time To First Occurrence Of Hospitalization For Heart Failure Or Cv Death In The Declare Study (Ebd84428 E4bd 415b Af5d 5832506b0e38 06)

Figure 4: Time To First Occurrence Of Hospitalization For Heart Failure Or Cv Death In The Declare Study (Ebd84428 E4bd 415b Af5d 5832506b0e38 06)
A line graph comparing the percentage of patients experiencing an event over time between dapagliflozin and placebo groups. The x-axis shows months from randomization up to 60 months, and the y-axis shows the percentage of patients with events, increasing from 0% to 7%. Dapagliflozin group shows a consistently lower event rate compared to placebo. The chart includes patient risk numbers below the x-axis for each time point.*
FDA Label Image

Figure 5: Time To First Occurrence Of Hospitalization For Heart Failure In The Declare Study (Ebd84428 E4bd 415b Af5d 5832506b0e38 07)

Figure 5: Time To First Occurrence Of Hospitalization For Heart Failure In The Declare Study (Ebd84428 E4bd 415b Af5d 5832506b0e38 07)
A line graph comparing the percentage of patients with an event over time (months from randomization) between dapagliflozin and placebo groups. The graph shows two lines, with the placebo group's line consistently higher than the dapagliflozin group, indicating fewer events in the dapagliflozin group. The x-axis represents months up to 60, and the y-axis represents the percentage of patients with events. Patient numbers at risk for each group are listed below the x-axis.*
FDA Label Image

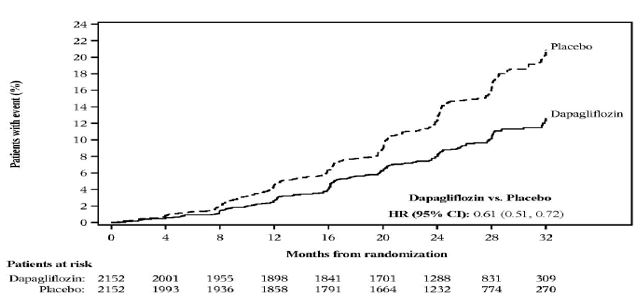
Figure 7: Time To First Occurrence Of The Primary Composite Endpoint, ≥50% Sustaineddecline In Egfr, Eskd, Cv Or Renal Death (dapa-ckd Study) (Ebd84428 E4bd 415b Af5d 5832506b0e38 08)

Figure 7: Time To First Occurrence Of The Primary Composite Endpoint, ≥50% Sustaineddecline In Egfr, Eskd, Cv Or Renal Death (dapa-ckd Study) (Ebd84428 E4bd 415b Af5d 5832506b0e38 08)
A line graph comparing patient event percentages over 32 months between Dapagliflozin and Placebo groups. The y-axis indicates percentage of patients with event, the x-axis shows months from randomization. Two lines, one for Dapagliflozin and one for Placebo, indicate event rates, with Placebo consistently higher. Patient numbers at risk are listed below the x-axis over time.*
FDA Label Image

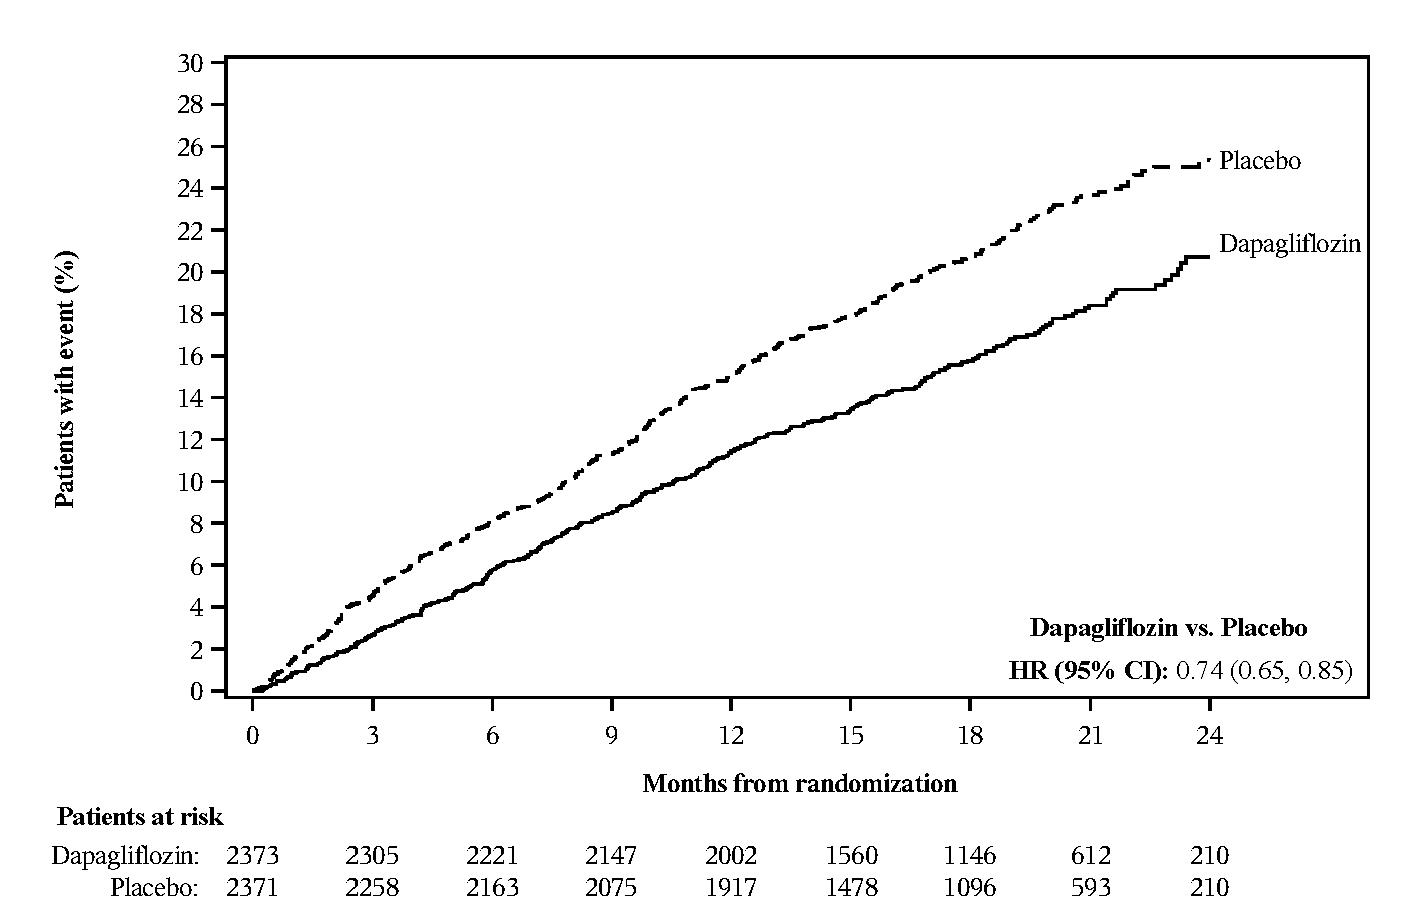
Figure 6: Time To The First Occurrence Of The Composite Of Cardiovascular Death, Hospitalization For Heart Failure Or Urgent Heart Failure Visit In The Dapa-hf Study (Ebd84428 E4bd 415b Af5d 5832506b0e38 09)

Figure 6: Time To The First Occurrence Of The Composite Of Cardiovascular Death, Hospitalization For Heart Failure Or Urgent Heart Failure Visit In The Dapa-hf Study (Ebd84428 E4bd 415b Af5d 5832506b0e38 09)
A line graph comparing the percentage of patients with an event over 24 months from randomization between dapagliflozin and placebo groups. The x-axis represents months, and the y-axis represents the percentage of patients with the event. Two lines are shown, with placebo represented by a dashed line and dapagliflozin by a solid line, indicating a lower event rate in the dapagliflozin group over time. Patient counts at risk for each time point are listed below the x-axis. The hazard ratio (HR) for dapagliflozin versus placebo is 0.74 with a 95% confidence interval of 0.65 to 0.85.*
FDA Label Image

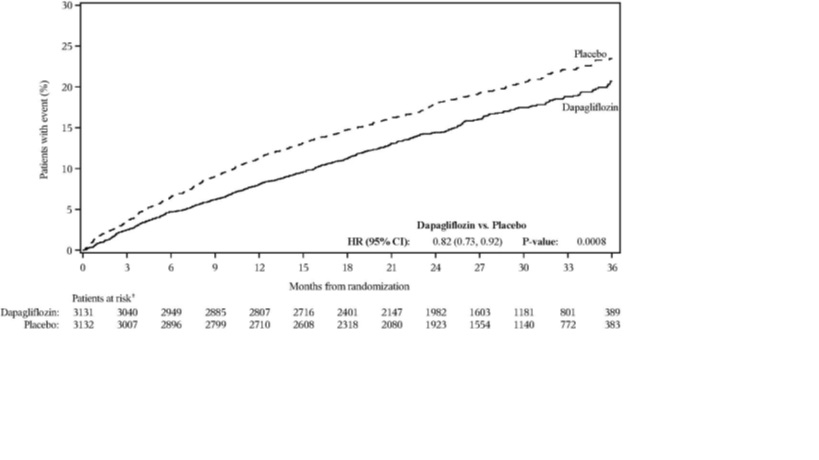
B) Deliver (Ebd84428 E4bd 415b Af5d 5832506b0e38 10)

B) Deliver (Ebd84428 E4bd 415b Af5d 5832506b0e38 10)
A Kaplan-Meier curve showing the percentage of patients with an event over 36 months comparing Dapagliflozin and Placebo groups. The graph plots months from randomization on the x-axis and percentage of patients with an event on the y-axis, with Dapagliflozin group showing a lower event rate than Placebo. Patient numbers at risk are listed below the graph over time, along with a hazard ratio and p-value indicating statistical analysis.*
FDA Label Image

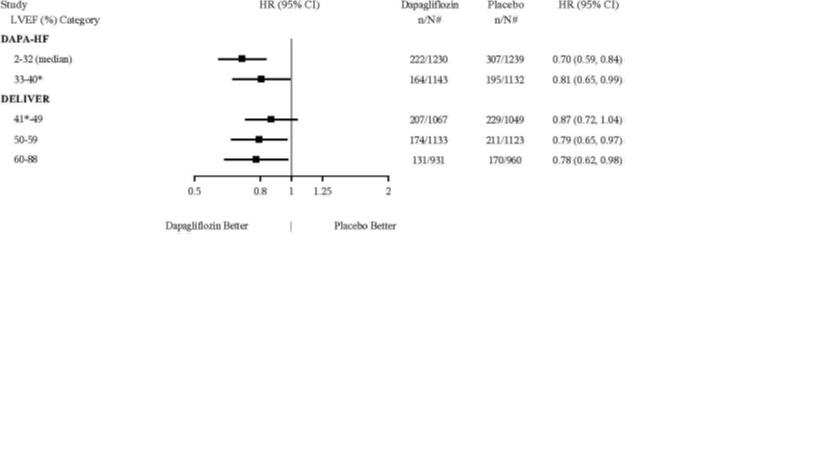
Figure 8 (Ebd84428 E4bd 415b Af5d 5832506b0e38 11)

Figure 8 (Ebd84428 E4bd 415b Af5d 5832506b0e38 11)
A forest plot chart comparing hazard ratios (HR) with 95% confidence intervals for Dapagliflozin versus placebo across different left ventricular ejection fraction (LVEF) categories in two studies, DAPA-HF and DELIVER. The plot shows point estimates and confidence intervals for HR values by LVEF subgroups with data numerically summarized in accompanying columns.*
FDA Label Image

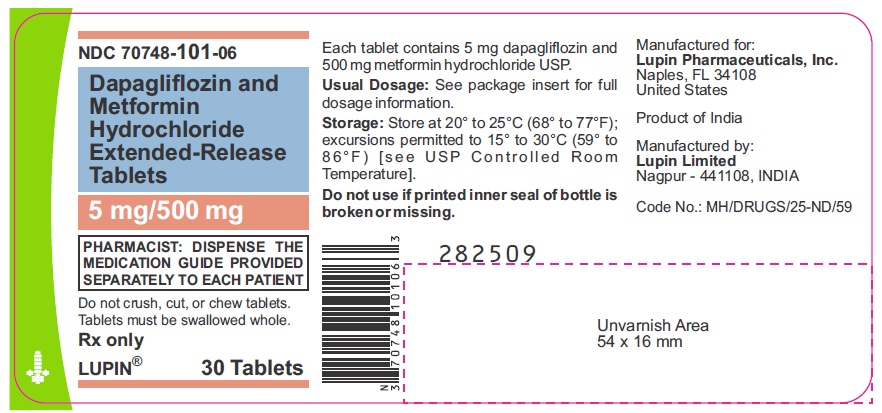
Image (Ebd84428 E4bd 415b Af5d 5832506b0e38 12)

Image (Ebd84428 E4bd 415b Af5d 5832506b0e38 12)
Label for Dapagliflozin and Metformin Hydrochloride Extended-Release Tablets, 5 mg/500 mg, an oral tablet dosage form. The label indicates a quantity of 30 tablets, manufactured by Lupin Pharmaceuticals, Inc. It includes directions to dispense the medication guide, storage instructions, and manufacturing details listing Lupin Limited in India as the manufacturer.*
FDA Label Image

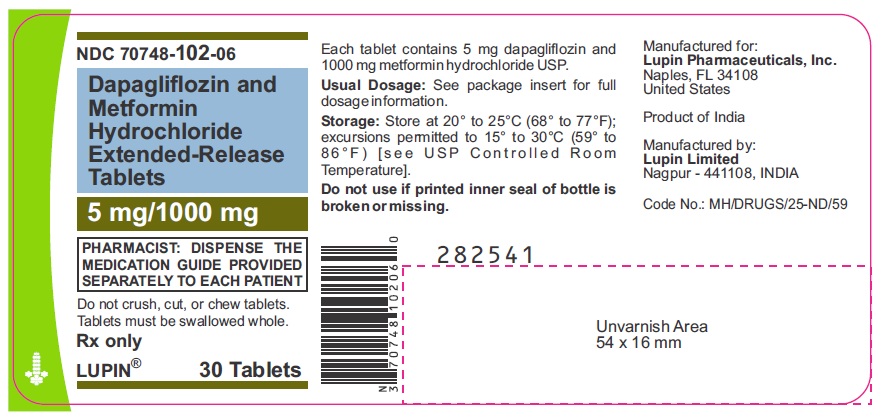
Image (Ebd84428 E4bd 415b Af5d 5832506b0e38 13)

Image (Ebd84428 E4bd 415b Af5d 5832506b0e38 13)
Label for Dapagliflozin and Metformin Hydrochloride Extended-Release Tablets 5 mg/1000 mg, oral dosage form. The label indicates a 30-tablet bottle dispensed by Lupin Pharmaceuticals, Inc., manufactured in India by Lupin Limited. It includes storage instructions and a pharmacist warning to provide the medication guide separately.*
FDA Label Image

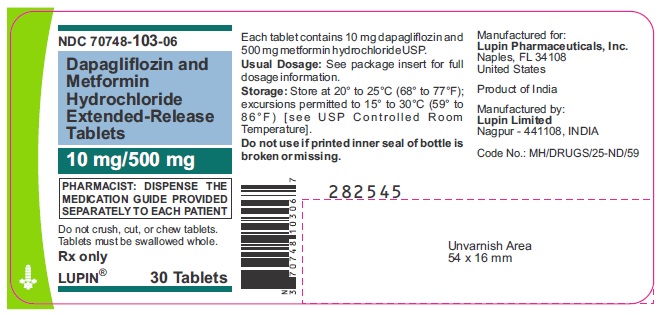
Image (Ebd84428 E4bd 415b Af5d 5832506b0e38 14)

Image (Ebd84428 E4bd 415b Af5d 5832506b0e38 14)
Label for Dapagliflozin and Metformin Hydrochloride Extended-Release Tablets 10 mg/500 mg by Lupin Pharmaceuticals, Inc. The label includes dosage form as tablets, strength, NDC 70748-103-06, storage instructions, and states 30 tablets per container with prescription use only.*
FDA Label Image

Image (Ebd84428 E4bd 415b Af5d 5832506b0e38 15)

Image (Ebd84428 E4bd 415b Af5d 5832506b0e38 15)
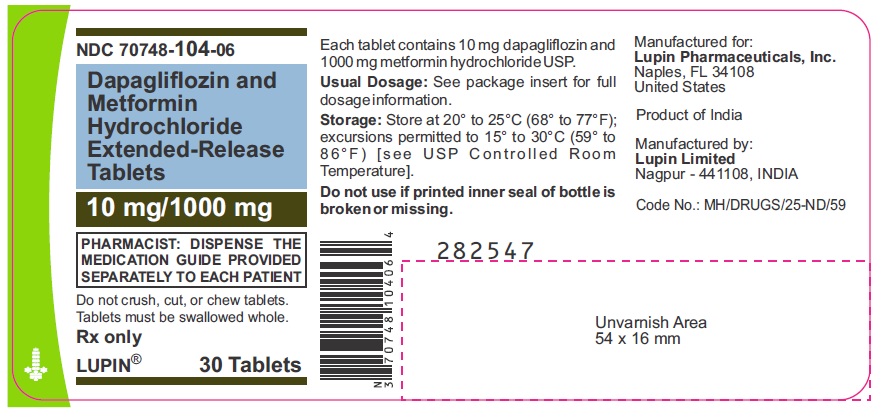
Label for Dapagliflozin and Metformin Hydrochloride Extended-Release Tablets, 10 mg/1000 mg strength, oral dosage form, containing 30 tablets. The label indicates storage instructions, manufacturer Lupin Pharmaceuticals, Inc., and manufacturing in India by Lupin Limited. It notes dispensing the medication guide and swallowing tablets whole, with a barcode and NDC 70748-104-06.*
FDA Label Image

Image (Ebd84428 E4bd 415b Af5d 5832506b0e38 160 1)

Image (Ebd84428 E4bd 415b Af5d 5832506b0e38 160 1)
The image shows a white and blue bottle label for DAPAGLIFLOZIN AND METFORMIN HYDROCHLORIDE extended release tablets. The label indicates the product is manufactured by Lupin Pharmaceuticals, Inc. The bottle is designed for oral administration with visible markings that imply a prescription drug.*
FDA Label Image

Image (Ebd84428 E4bd 415b Af5d 5832506b0e38 283 2)

* About these descriptions: Image descriptions on this page are generated by automated AI analysis of the product label images from the manufacturer's FDA label submission (SPL). They are provided for reference only and may contain errors or omissions. Always rely on the printed label itself and the official FDA labeling, and consult a pharmacist or healthcare professional with any questions about this product.