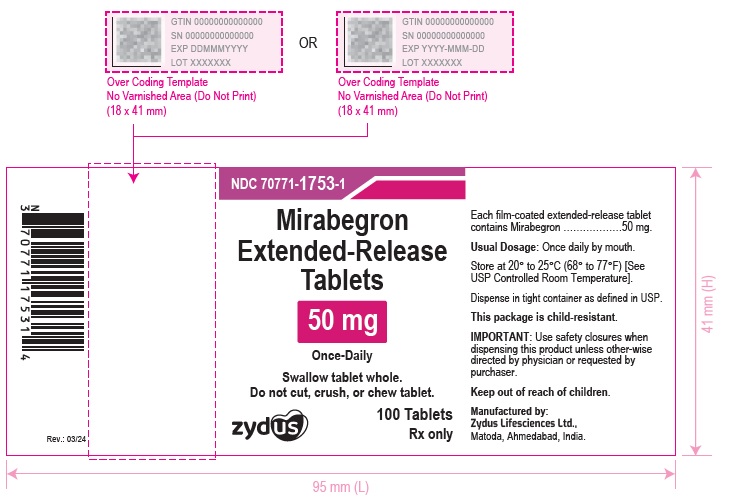
Mirabegron Tablet, Extended Release
Product Images NDC 70771-1753

11 FDA label images from Zydus Lifesciences Limited · Packaging, Regulatory Labels, and Product Appearance

Product Visual Gallery

This gallery contains 11 technical images submitted to the FDA as part of the official labeling for Mirabegron (NDC 70771-1753). Unlike standard consumer photos, these assets often include clinical data figures, molecular chemical structures, and official manufacturer packaging layouts.

As provided by Zydus Lifesciences Limited, these visuals offer a comprehensive scientific overview of the product's physical and chemical identity, aiding pharmacists and researchers in product verification and study.

FDA Label Image

Structure (2c538bd8 5345 4a9f 8370 B5b81e9edf3a 01)
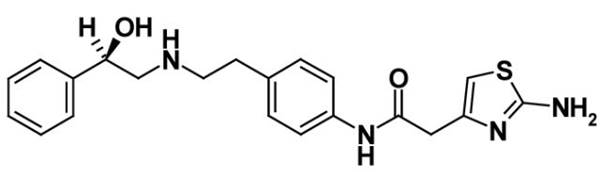
Structure (2c538bd8 5345 4a9f 8370 B5b81e9edf3a 01)
Chemical structure of Mirabegron, showing its molecular framework including aromatic rings, hydroxyl group, amine groups, and a thiadiazole ring with an amino substituent.*
FDA Label Image

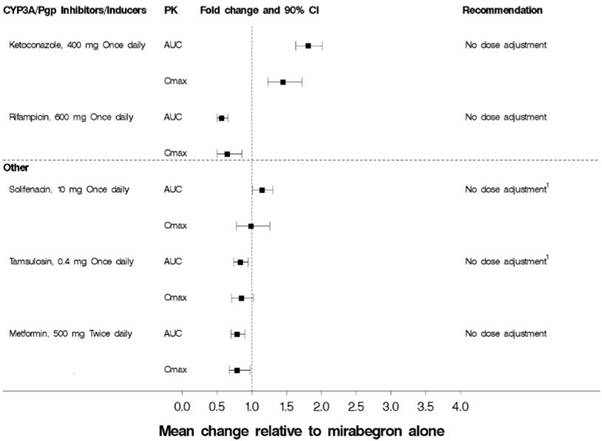
Figure 1 (2c538bd8 5345 4a9f 8370 B5b81e9edf3a 02)

Figure 1 (2c538bd8 5345 4a9f 8370 B5b81e9edf3a 02)
A chart showing pharmacokinetic fold changes and 90% confidence intervals for various CYP3A/Pgp inhibitors and inducers relative to mirabegron alone. The x-axis displays the mean change relative to mirabegron alone. Listed drugs include ketoconazole, rifampicin, solifenacin, tamsulosin, and metformin with their corresponding dosing and pharmacokinetic parameters AUC and Cmax. Recommendations on dose adjustment are noted alongside.*
FDA Label Image

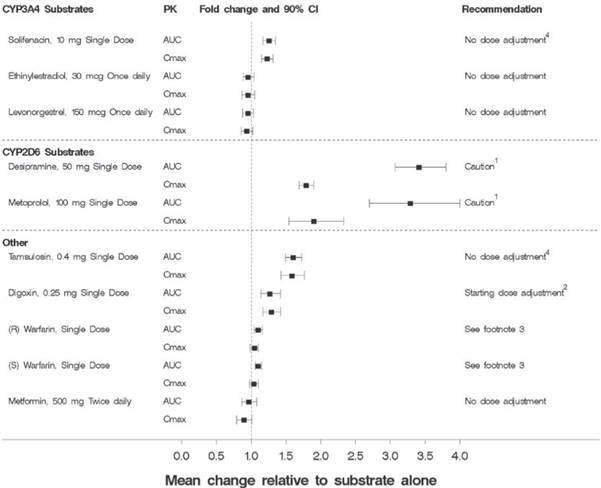
Figure 2 (2c538bd8 5345 4a9f 8370 B5b81e9edf3a 03)

Figure 2 (2c538bd8 5345 4a9f 8370 B5b81e9edf3a 03)
A chart depicting the fold change and 90% confidence intervals of pharmacokinetic parameters (AUC and Cmax) for various CYP3A4 and CYP2D6 substrates, as well as other drugs, relative to substrate alone. It includes recommendations on dose adjustment for each drug, ranging from no dose adjustment to specific cautions or footnotes, illustrating interaction effects with an unspecified treatment.*
FDA Label Image

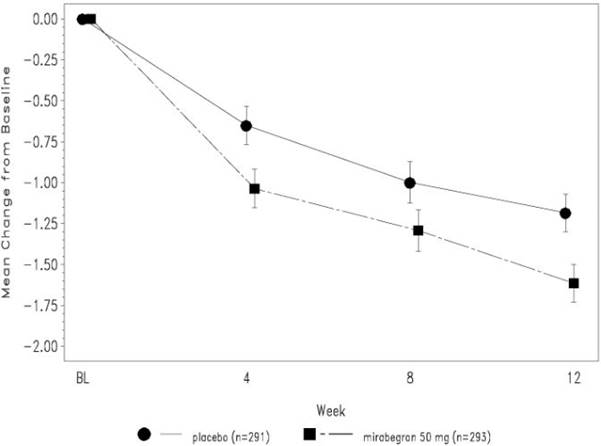
Figure 3 (2c538bd8 5345 4a9f 8370 B5b81e9edf3a 04)

Figure 3 (2c538bd8 5345 4a9f 8370 B5b81e9edf3a 04)
This line graph depicts the mean change from baseline over 12 weeks comparing placebo and Mirabegron 50 mg. The x-axis represents the weeks (baseline, 4, 8, 12) and the y-axis shows mean change from baseline. Mirabegron 50 mg shows a greater decrease over time than placebo, with data points and error bars for both groups.*
FDA Label Image

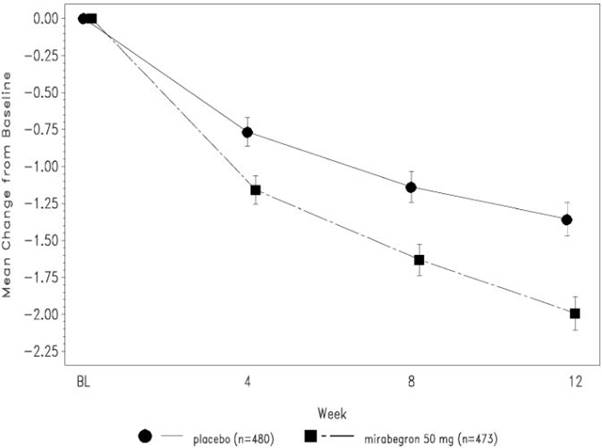
Figure 4 (2c538bd8 5345 4a9f 8370 B5b81e9edf3a 05)

Figure 4 (2c538bd8 5345 4a9f 8370 B5b81e9edf3a 05)
A line graph depicting mean change from baseline over 12 weeks for two groups: placebo and mirabegron 50 mg. The x-axis shows time in weeks (BL, 4, 8, 12), and the y-axis shows mean change from baseline values. The mirabegron 50 mg group shows a greater decrease over time compared to placebo, with error bars indicating variability at each time point.*
FDA Label Image

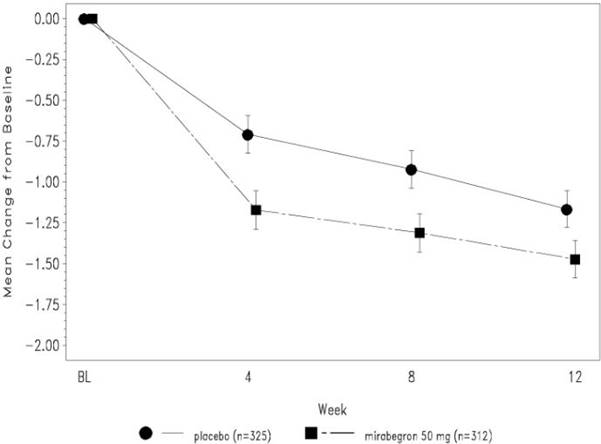
Figure 5 (2c538bd8 5345 4a9f 8370 B5b81e9edf3a 06)

Figure 5 (2c538bd8 5345 4a9f 8370 B5b81e9edf3a 06)
A line graph depicting the mean change from baseline over 12 weeks, comparing mirabegron 50 mg (n=312) and placebo (n=325) groups. The y-axis shows mean change from baseline and the x-axis shows weeks (BL, 4, 8, 12). Mirabegron demonstrates a greater reduction than placebo across all time points with error bars shown.*
FDA Label Image

Figure 6 (2c538bd8 5345 4a9f 8370 B5b81e9edf3a 07)

Figure 6 (2c538bd8 5345 4a9f 8370 B5b81e9edf3a 07)
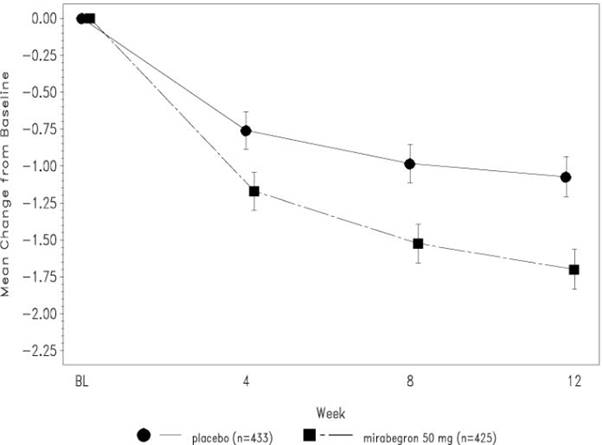
A line graph comparing the mean change from baseline over 12 weeks between placebo and Mirabegron 50 mg groups. The x-axis represents weeks (BL, 4, 8, 12), and the y-axis represents mean change from baseline. Two lines show data points with error bars for placebo (n=433) and Mirabegron 50 mg (n=425), indicating a greater decrease over time in the Mirabegron group.*
FDA Label Image

Figure 7 (2c538bd8 5345 4a9f 8370 B5b81e9edf3a 08)

Figure 7 (2c538bd8 5345 4a9f 8370 B5b81e9edf3a 08)
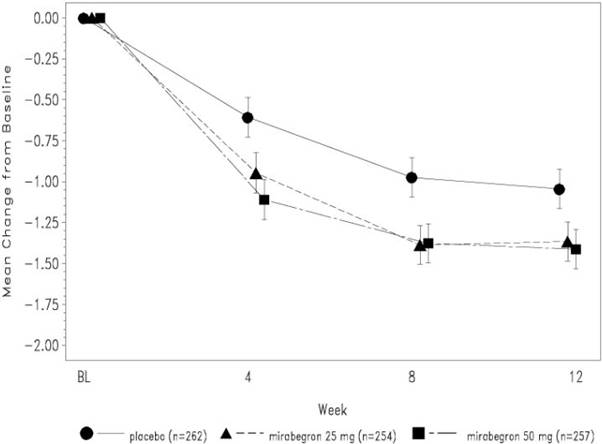
A line graph illustrating mean change from baseline over 12 weeks for placebo and two doses of Mirabegron extended-release tablets (25 mg and 50 mg). The x-axis represents time points at baseline, week 4, week 8, and week 12, while the y-axis shows mean change from baseline values. The graph includes data points with error bars for placebo (circles), Mirabegron 25 mg (triangles, dashed line), and Mirabegron 50 mg (squares, dash-dotted line).*
FDA Label Image

Figure 8 (2c538bd8 5345 4a9f 8370 B5b81e9edf3a 09)

Figure 8 (2c538bd8 5345 4a9f 8370 B5b81e9edf3a 09)
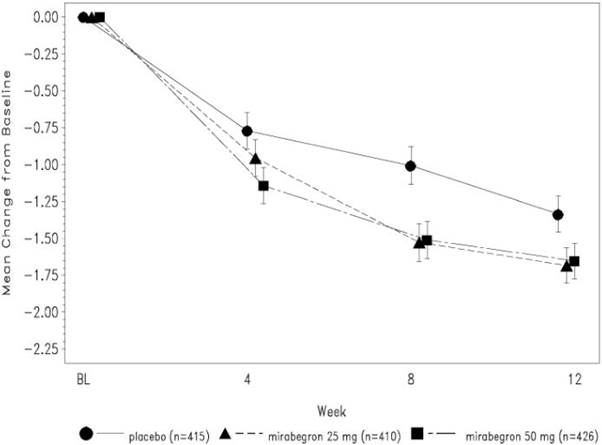
A line chart showing the mean change from baseline over 12 weeks for placebo, Mirabegron 25 mg, and Mirabegron 50 mg groups. The x-axis represents weeks (BL, 4, 8, 12) and the y-axis shows mean change from baseline, with all groups displaying a downward trend over time. Error bars indicate variability around each mean value.*
FDA Label Image

Mirabegron Extended-release Tablets, 25mg (2c538bd8 5345 4a9f 8370 B5b81e9edf3a 10)

Mirabegron Extended-release Tablets, 25mg (2c538bd8 5345 4a9f 8370 B5b81e9edf3a 10)
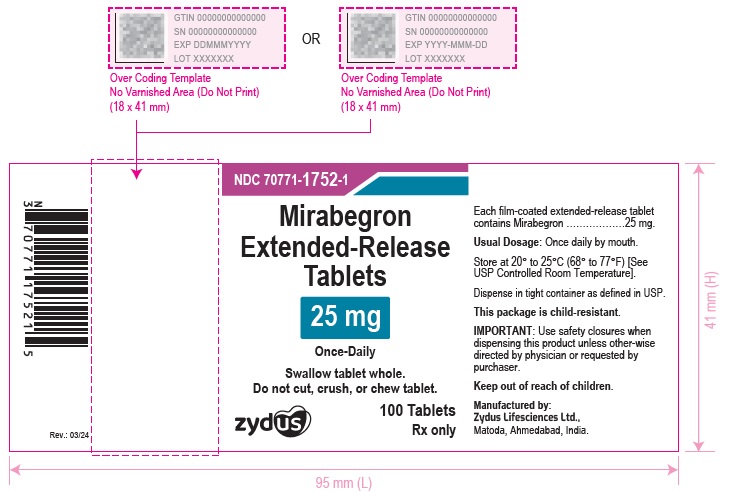
Label for Mirabegron Extended-Release Tablets 25 mg by Zydus Lifesciences Limited. The oral, once-daily tablet pack contains 100 tablets. The label includes usage instructions, storage conditions, and warnings such as swallow whole and child-resistant packaging. The NDC is 70771-1752-1.*
FDA Label Image

Mirabegron Extended-release Tablets, 50mg (2c538bd8 5345 4a9f 8370 B5b81e9edf3a 11)

Mirabegron Extended-release Tablets, 50mg (2c538bd8 5345 4a9f 8370 B5b81e9edf3a 11)
Label for Mirabegron Extended-Release Tablets 50 mg oral tablets by Zydus Lifesciences Limited. The label indicates a 100-tablet prescription package with instructions for once-daily dosing and storage at controlled room temperature. It notes the product is child-resistant and should not be cut, crushed, or chewed.*

* About these descriptions: Image descriptions on this page are generated by automated AI analysis of the product label images from the manufacturer's FDA label submission (SPL). They are provided for reference only and may contain errors or omissions. Always rely on the printed label itself and the official FDA labeling, and consult a pharmacist or healthcare professional with any questions about this product.