Sitagliptin And Metformin Hydrochloride Tablet, Film Coated
Product Images NDC 70771-1869

6 FDA label images from Zydus Lifesciences Limited · Packaging, Regulatory Labels, and Product Appearance

Product Visual Gallery

This gallery contains 6 technical images submitted to the FDA as part of the official labeling for Sitagliptin And Metformin Hydrochloride (NDC 70771-1869). Unlike standard consumer photos, these assets often include clinical data figures, molecular chemical structures, and official manufacturer packaging layouts.

As provided by Zydus Lifesciences Limited, these visuals offer a comprehensive scientific overview of the product's physical and chemical identity, aiding pharmacists and researchers in product verification and study.

FDA Label Image

Structure (20a7af2d 467c 4f70 880c 49192be5d8b8 01)
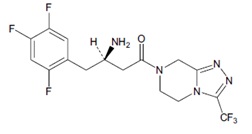
Structure (20a7af2d 467c 4f70 880c 49192be5d8b8 01)
Chemical structure diagram depicting the molecular structure of Sitagliptin, one of the active ingredients in the Sitagliptin and Metformin Hydrochloride combination tablet. The structure includes rings and fluorine (F) and trifluoromethyl (CF3) groups as part of the molecule.*
FDA Label Image

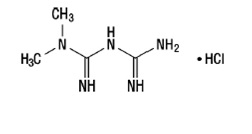
Structure (20a7af2d 467c 4f70 880c 49192be5d8b8 02)

Structure (20a7af2d 467c 4f70 880c 49192be5d8b8 02)
Chemical structure diagram of sitagliptin hydrochloride, showing its molecular framework including nitrogen, carbon, hydrogen atoms, and the attached hydrochloride (HCl) group.*
FDA Label Image

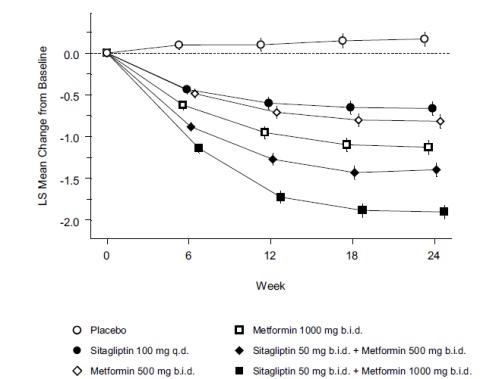
Graph (20a7af2d 467c 4f70 880c 49192be5d8b8 03)

Graph (20a7af2d 467c 4f70 880c 49192be5d8b8 03)
A line graph depicting the least squares mean change from baseline over 24 weeks for different treatment groups: placebo, metformin 1000 mg twice daily, sitagliptin 100 mg once daily, sitagliptin 50 mg twice daily, metformin 500 mg twice daily, and sitagliptin 50 mg plus metformin 1000 mg twice daily. The y-axis measures LS mean change from baseline; the x-axis represents weeks (0 to 24).*
FDA Label Image

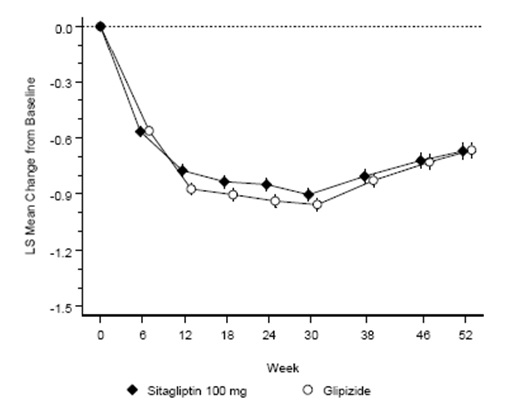
Graph (20a7af2d 467c 4f70 880c 49192be5d8b8 04)

Graph (20a7af2d 467c 4f70 880c 49192be5d8b8 04)
Line graph depicting the least squares mean change from baseline over 52 weeks for Sitagliptin 100 mg and Glipizide. The y-axis shows change values, ranging approximately from 0.0 to -1.5, while the x-axis represents weeks (0 to 52). Both treatments show a decrease initially up to about week 30, followed by a slight increase toward week 52.*
FDA Label Image

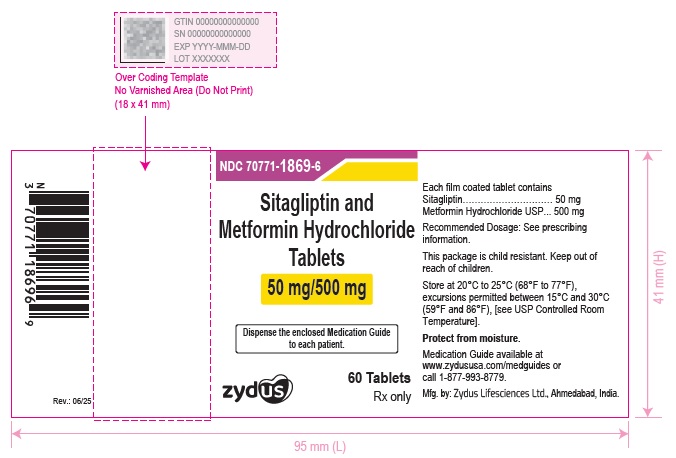
Label (20a7af2d 467c 4f70 880c 49192be5d8b8 05)

Label (20a7af2d 467c 4f70 880c 49192be5d8b8 05)
Label for Sitagliptin and Metformin Hydrochloride Tablets 50 mg/500 mg by Zydus Lifesciences Limited. The film-coated tablets come in a 60 count package. The label includes the NDC 70771-1869-6, dosage strengths, handling instructions, and manufacturer details. It also directs to dispense the enclosed Medication Guide with the product.*
FDA Label Image

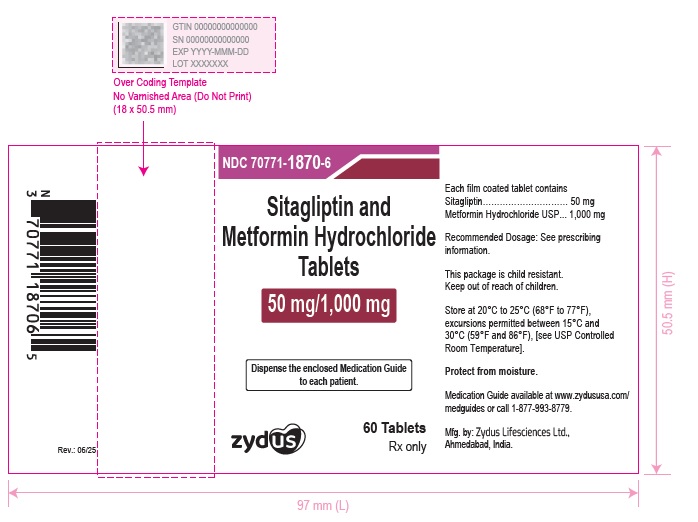
Label (20a7af2d 467c 4f70 880c 49192be5d8b8 06)

Label (20a7af2d 467c 4f70 880c 49192be5d8b8 06)
Label for Sitagliptin and Metformin Hydrochloride Tablets, 50 mg/1,000 mg film-coated oral tablets. The package contains 60 tablets and is labeled for prescription use only. The manufacturer is Zydus Lifesciences Limited, Ahmedabad, India. The label includes storage instructions, a warning about child resistance and moisture protection, and contact information for the medication guide.*

* About these descriptions: Image descriptions on this page are generated by automated AI analysis of the product label images from the manufacturer's FDA label submission (SPL). They are provided for reference only and may contain errors or omissions. Always rely on the printed label itself and the official FDA labeling, and consult a pharmacist or healthcare professional with any questions about this product.