Clopidogrel
Product Images NDC 70786-0060

11 FDA label images from Unit Dose Services · Packaging, Regulatory Labels, and Product Appearance

Product Visual Gallery

This gallery contains 11 technical images submitted to the FDA as part of the official labeling for Clopidogrel (NDC 70786-0060). Unlike standard consumer photos, these assets often include clinical data figures, molecular chemical structures, and official manufacturer packaging layouts.

As provided by Unit Dose Services, these visuals offer a comprehensive scientific overview of the product's physical and chemical identity, aiding pharmacists and researchers in product verification and study.

FDA Label Image

Figure-03 (Clopidogrel Fig 3)
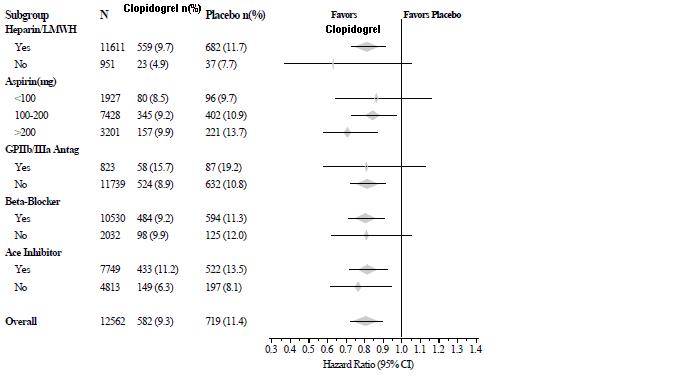
Figure-03 (Clopidogrel Fig 3)
A forest plot illustrating hazard ratios with 95% confidence intervals for subgroups comparing Clopidogrel and placebo. Subgroups include Heparin/LMWH usage, aspirin dose categories, GPIIb/IIIa antagonist, beta-blocker, and ACE inhibitor usage. The plot shows the number of subjects and events in each group and the direction favoring Clopidogrel or placebo.*
FDA Label Image

Figure-1 (Clopidogrel Figure 01)

Figure-1 (Clopidogrel Figure 01)
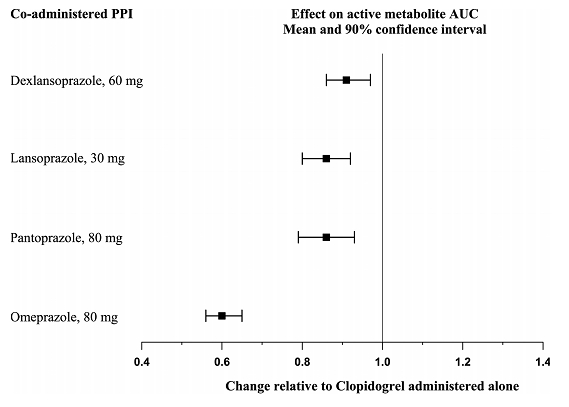
A horizontal error bar chart illustrating the effect of co-administered proton pump inhibitors (PPIs) on the active metabolite area under the curve (AUC) of Clopidogrel. Four PPIs are compared: Dexlansoprazole 60 mg, Lansoprazole 30 mg, Pantoprazole 80 mg, and Omeprazole 80 mg, with changes relative to Clopidogrel administered alone shown along the x-axis from 0.4 to 1.4, including mean values and 90% confidence intervals.*
FDA Label Image

Figure-2 (Clopidogrel Figure 02)

Figure-2 (Clopidogrel Figure 02)
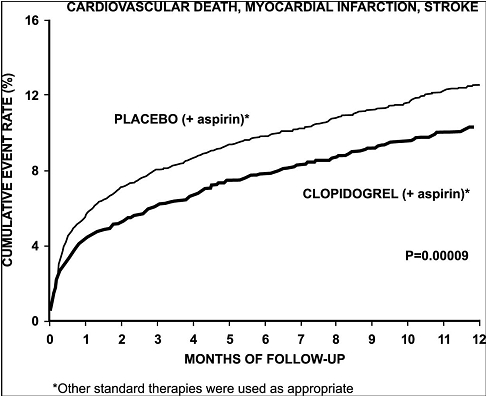
A line graph showing cumulative event rates in percentage over 12 months of follow-up for cardiovascular death, myocardial infarction, and stroke. Two curves compare placebo (+ aspirin) and clopidogrel (+ aspirin) treatment groups, with the clopidogrel group showing lower cumulative event rates. A p-value of 0.00009 is indicated, suggesting statistical significance.*
FDA Label Image

Figure-4 (Clopidogrel Figure 04)

Figure-4 (Clopidogrel Figure 04)
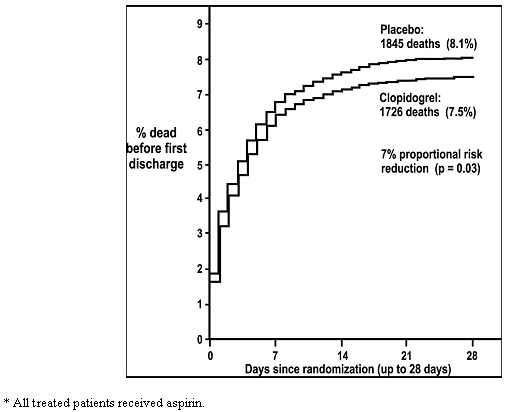
A Kaplan-Meier survival curve showing percentage of deaths before first discharge over 28 days after randomization, comparing Clopidogrel and placebo groups. The graph indicates fewer deaths in the Clopidogrel group (7.5%) compared to placebo (8.1%), with a noted 7% proportional risk reduction (p = 0.03).*
FDA Label Image

Figure-5 (Clopidogrel Figure 05)

Figure-5 (Clopidogrel Figure 05)
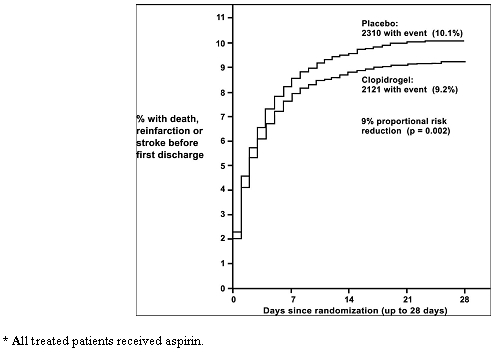
A Kaplan-Meier curve comparing the percentage of patients with death, reinfarction, or stroke before first discharge over 28 days between Clopidogrel and placebo groups. The graph shows cumulative event rates over days since randomization, indicating a 9% proportional risk reduction for Clopidogrel compared to placebo.*
FDA Label Image

Fig-7 (Clopidogrel Figure 07)

Fig-7 (Clopidogrel Figure 07)
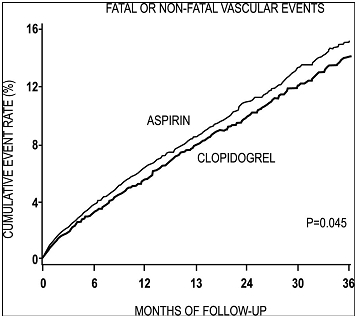
A line graph comparing cumulative event rates of fatal or non-fatal vascular events over 36 months of follow-up for patients taking aspirin versus clopidogrel. The y-axis represents cumulative event rate (%) ranging from 0 to 16%, and the x-axis shows months of follow-up from 0 to 36. The curve for aspirin is slightly higher than clopidogrel across time, with a reported p-value of 0.045 indicating statistical comparison.*
FDA Label Image

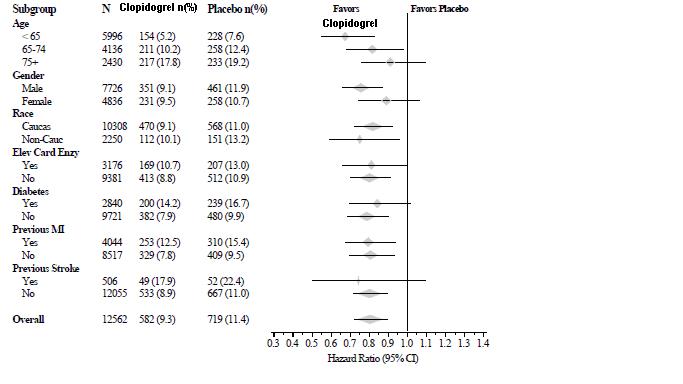
Figure-3 (Clopidogrel Figure 3)

Figure-3 (Clopidogrel Figure 3)
A forest plot chart comparing Clopidogrel and placebo outcomes across various subgroups, including age, gender, race, enzyme status, diabetes, previous myocardial infarction, and previous stroke. The chart displays hazard ratios with 95% confidence intervals indicating favor towards Clopidogrel or placebo for each subgroup and overall population.*
FDA Label Image

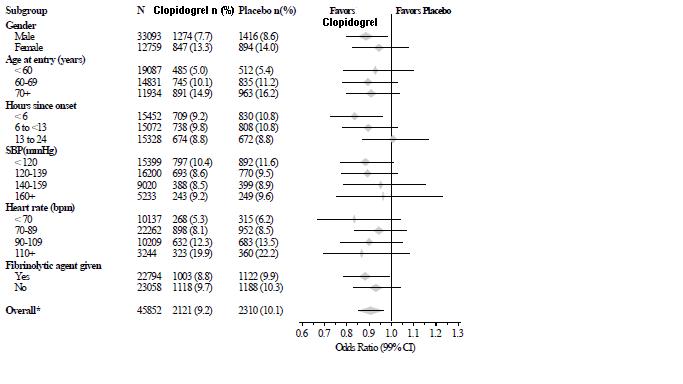
Figure-6 (Clopidogrel Figure 6)

Figure-6 (Clopidogrel Figure 6)
A forest plot showing odds ratios with 99% confidence intervals comparing Clopidogrel and placebo across various subgroups including gender, age, hours since onset, systolic blood pressure (SBP), heart rate, and fibrinolytic agent use. The plot visually represents the favorability towards Clopidogrel or placebo in these subgroups based on the odds ratio scale from 0.6 to 1.3.*
FDA Label Image

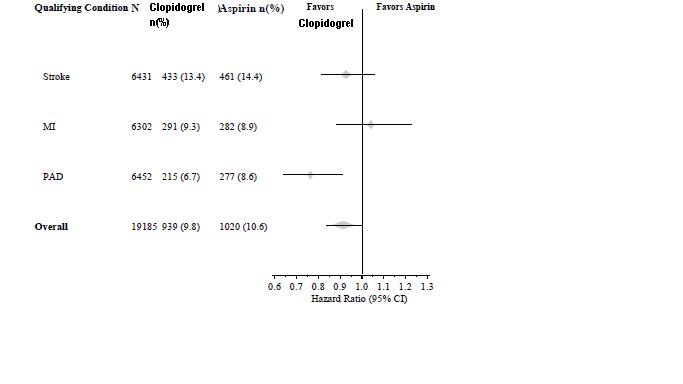
Figure-8 (Clopidogrel Figure 8)

Figure-8 (Clopidogrel Figure 8)
A forest plot chart depicting favorability comparisons between Clopidogrel and Aspirin across qualifying conditions: Stroke, MI, PAD, and Overall. The x-axis represents Hazard Ratio (95% CI) ranging from 0.6 to 1.3, with data points and confidence intervals shown for each condition, indicating relative favor toward Clopidogrel or Aspirin.*
FDA Label Image

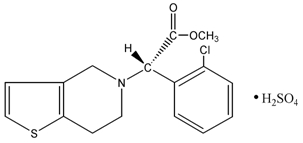
Structure (Clopidogrel Structure)

Structure (Clopidogrel Structure)
Chemical structure diagram of Clopidogrel, showing the molecular arrangement including the thiophene ring, piperidine ring, ester group, chlorine-substituted benzene ring, and associated sulfuric acid (H2SO4) molecule.*
FDA Label Image

Label Image (Lbl707860060)

Label Image (Lbl707860060)
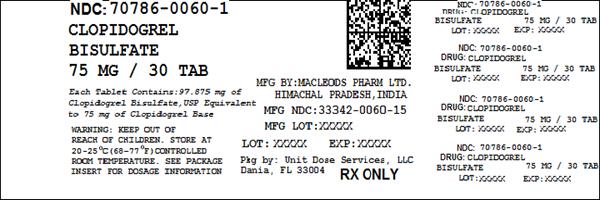
Clopidogrel Bisulfate 75 mg tablets, bottle label showing 30 tablets per container. The label includes NDC 70786-0060-1, manufacturer Macleods Pharm Ltd from Himachal Pradesh, India, and repackaged by Unit Dose Services, LLC in Dania, FL. The label states each tablet contains 97.875 mg of clopidogrel bisulfate USP equivalent to 75 mg clopidogrel base. Storage instructions and RX only designation are also shown.*

* About these descriptions: Image descriptions on this page are generated by automated AI analysis of the product label images from the manufacturer's FDA label submission (SPL). They are provided for reference only and may contain errors or omissions. Always rely on the printed label itself and the official FDA labeling, and consult a pharmacist or healthcare professional with any questions about this product.