Fulvestrant Injection, Solution
Product Images NDC 70860-211

16 FDA label images from Athenex Pharmaceutical Division, Llc. · Packaging, Regulatory Labels, and Product Appearance

Product Visual Gallery

This gallery contains 16 technical images submitted to the FDA as part of the official labeling for Fulvestrant (NDC 70860-211). Unlike standard consumer photos, these assets often include clinical data figures, molecular chemical structures, and official manufacturer packaging layouts.

As provided by Athenex Pharmaceutical Division, Llc., these visuals offer a comprehensive scientific overview of the product's physical and chemical identity, aiding pharmacists and researchers in product verification and study.

FDA Label Image

Ful05 0005 01

Ful05 0005 01
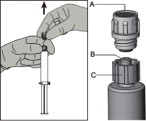
An instructional diagram showing how to prepare an injection. It illustrates twisting a cap off a vial, with labeled parts indicating the cap (A), vial neck (B), and vial body (C). The image visually guides the removal of the cap from the vial before use.*
FDA Label Image

Ful05 0005 02

Ful05 0005 02
An instructional illustration showing the preparation of Fulvestrant injection. One part depicts a hand attaching a syringe to the vial connector to withdraw the solution. The other part shows a close-up of the vial connector parts labeled A, B, and C, demonstrating how the syringe is connected to the vial for intramuscular injection preparation.*
FDA Label Image

Ful05 0005 03

Ful05 0005 03
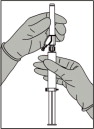
An instructional illustration showing hands preparing a syringe, with one hand holding the syringe and the other hand drawing liquid from a vial. The image demonstrates the process of drawing medication, likely for intramuscular injection.*
FDA Label Image

Ful05 0005 04

Ful05 0005 04
An instructional line drawing of an intramuscular injection device featuring a syringe with a needle and plunger. Includes a magnified inset showing the needle's tip detail, illustrating the proper injection method.*
FDA Label Image

Ful05 0005 05

Ful05 0005 05
An instructional illustration showing a gloved hand holding a syringe. The image depicts a step in the injection process, with arrows indicating the direction of movement for the syringe plunger and needle position, likely demonstrating how to prepare or administer an intramuscular injection.*
FDA Label Image

Ful05 0005 06

Ful05 0005 06
Chemical structure of fulvestrant, showing its steroid backbone with hydroxyl groups and a side chain containing sulfonate and trifluoromethyl groups.*
FDA Label Image

Ful05 0005 07

Ful05 0005 07
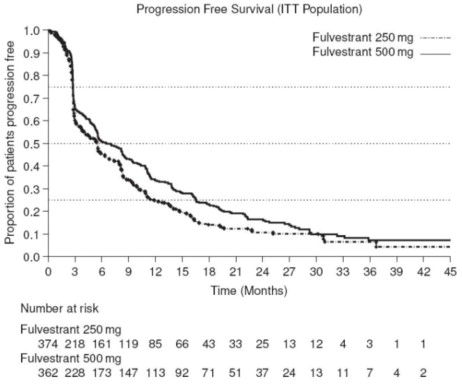
A Kaplan-Meier survival curve graph showing progression-free survival in an ITT population comparing two doses of Fulvestrant, 250 mg and 500 mg, over time in months. The y-axis represents the proportion of patients progression free, and the x-axis shows time from 0 to 45 months. A table below the graph lists the number of patients at risk at various time points for each dose group.*
FDA Label Image

Ful05 0005 08

Ful05 0005 08
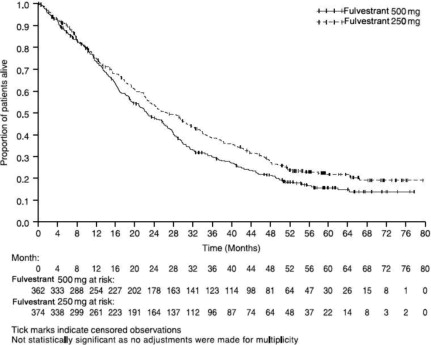
A survival curve chart displaying the proportion of patients alive over time in months, comparing Fulvestrant doses of 500 mg and 250 mg. The graph includes censored observation tick marks and tables showing patients at risk for each dose at various time points up to 80 months.*
FDA Label Image

Ful05 0005 09

Ful05 0005 09
A Kaplan-Meier survival curve chart showing the probability of progression-free survival (PFS) over time in months from randomization. It compares two treatment groups: Fulvestrant 500 mg and Anastrozole 1 mg, with respective numbers at risk indicated below the x-axis.*
FDA Label Image

Ful05 0005 10

Ful05 0005 10
A Kaplan-Meier curve comparing progression-free survival probability (%) over time in months between two groups: fulvestrant plus palbociclib and fulvestrant plus placebo. The graph includes a risk table showing the number of patients at risk at various time points for each group.*
FDA Label Image

Ful05 0005 11

Ful05 0005 11
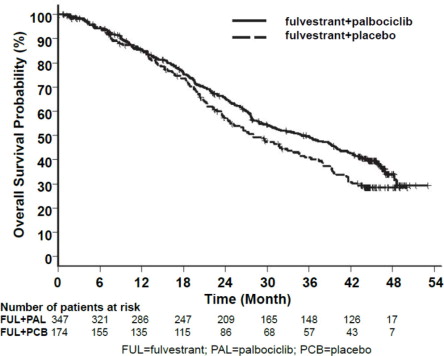
A Kaplan-Meier survival curve chart depicting overall survival probability (%) over time in months for patients treated with fulvestrant plus palbociclib compared to fulvestrant plus placebo. The chart includes patient counts at risk for each treatment group at various time points up to 54 months.*
FDA Label Image

Ful05 0005 12

Ful05 0005 12
A Kaplan-Meier curve chart illustrating progression-free survival probability over time in months, comparing two patient groups treated with Fulvestrant plus Abemaciclib and Fulvestrant plus Placebo. The graph includes censored observations and a table displaying the number of patients at risk at various time points.*
FDA Label Image

Ful05 0005 13

Ful05 0005 13
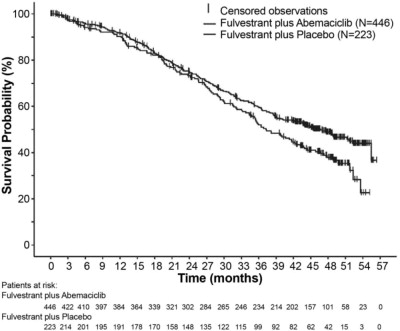
A line chart depicting survival probability percentages over time in months for two patient groups: one treated with Fulvestrant plus Abemaciclib, and the other with Fulvestrant plus placebo. The chart includes censored observations and a table of patients at risk at various time points below the x-axis.*
FDA Label Image

Ful05 0005 14

Ful05 0005 14
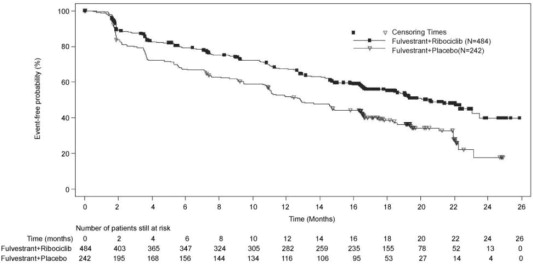
A Kaplan-Meier survival curve chart showing event-free probability (%) over time in months up to 26 months. The graph compares three groups: Fulvestrant+Ribociclib, Fulvestrant+Placebo, and Censoring Times, with a table below showing the number of patients at risk at various time points for each group.*
FDA Label Image

Ful05 0005 15

Ful05 0005 15
A Kaplan-Meier survival curve showing event-free probability (%) over time (months) comparing Fulvestrant plus Ribociclib (N=484) and Fulvestrant plus Placebo (N=242). The chart includes censoring times and a table of patients at risk below the x-axis, depicting the decreasing event-free probability for both treatment groups over 48 months.*
FDA Label Image

Ful05 0005 16

Ful05 0005 16
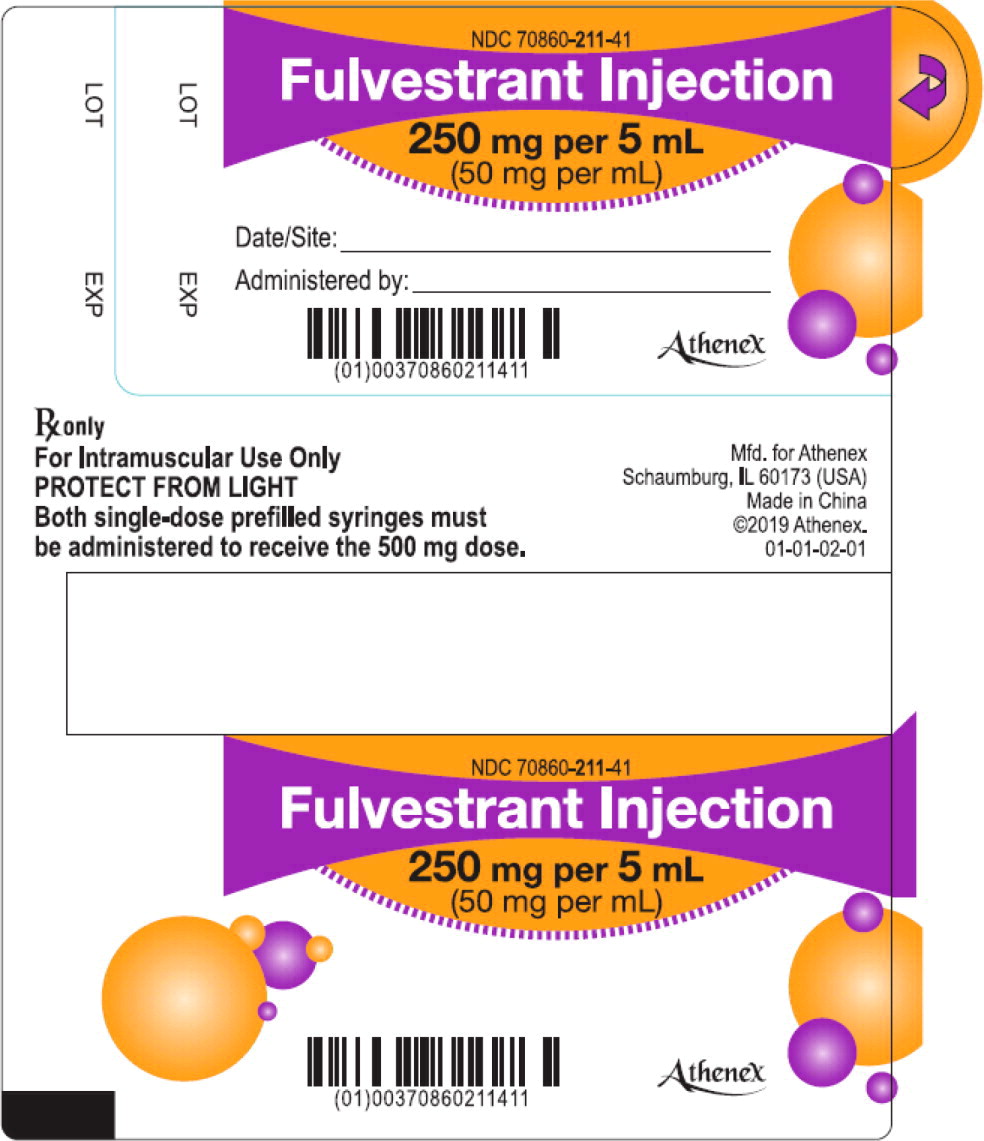
Label for Fulvestrant Injection 250 mg per 5 mL (50 mg per mL) solution for intramuscular injection. The label includes the NDC 70860-211-41, manufacturer Athenex Pharmaceutical Division, LLC, and notes the product is for intramuscular use only and should be protected from light. The label displays dosage instructions for two single-dose prefilled syringes to achieve a 500 mg dose, with barcode and lot/expiration fields.*

* About these descriptions: Image descriptions on this page are generated by automated AI analysis of the product label images from the manufacturer's FDA label submission (SPL). They are provided for reference only and may contain errors or omissions. Always rely on the printed label itself and the official FDA labeling, and consult a pharmacist or healthcare professional with any questions about this product.