Atorvastatin Calcium
Product Images NDC 70934-250

View Photos of Packaging, Regulatory Labels, and Product Appearance

Product Visual Gallery

This gallery contains 5 technical images submitted to the FDA as part of the official labeling for Atorvastatin Calcium (NDC 70934-250). Unlike standard consumer photos, these assets often include clinical data figures, molecular chemical structures, and official manufacturer packaging layouts.

As provided by Denton Pharma, Inc. Dba Northwind Pharmaceuticals, these visuals offer a comprehensive scientific overview of the product's physical and chemical identity, aiding pharmacists and researchers in product verification and study.

FDA Label Image

Label (70934 250 90 Rev A 01 19)

Label (70934 250 90   Rev A 01 19)
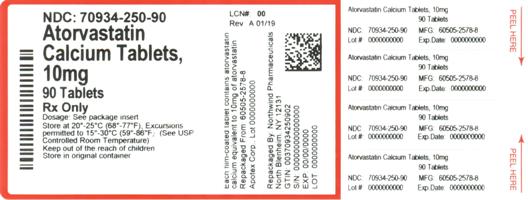
This is a description of medication with the name Atorvastatin in the form of Calcium Tablets with a strength of 10mg per tablet. The package contains 90 tablets and requires a prescription for use. The National Drug Code (NDC) of the medication is 70934-250-90. No further information is available due to the limited text obtained through .*
FDA Label Image

Figure-01 (Figure 01)

FDA Label Image

Figure-02 (Figure 02)

Figure-02 (Figure 02)
The text appears to be a graph or table with the title "Cumulative Hazard (%)" and data related to a drug called Atorvastatin. The graph may show the hazard percentage at 10 and 15 for the drug Atorvastatin, and there is a horizontal axis with five time points labeled as "1 2 3 4 5". However, without further context or a visual of the graph, it is difficult to interpret the exact meaning or purpose of the data.*
FDA Label Image

Figure-03 (Figure 03)

Figure-03 (Figure 03)
The text appears to be showing results from a study or clinical trial involving two drugs - Horvastatin (10mg) and Sorvastatin (80mg) - and their effects on reducing the risk of experiencing E-vert (presumably a medical condition). There is a chart showing the percentage of subjects who experienced E-vert during the study, and a reference to a HR (hazard ratio) of 0.78 with a P-value of 0.0002. The text also appears to reference a "Major Cardiovascular Endpoint" and shows the time elapsed before subjects experienced this endpoint over a period of 4 years.*
FDA Label Image

Chemical-structure (Chemical Structure)

* These product label images have been analyzed using experimental machine learning. Please verify findings with the primary label text.