70934 306 30 Master Bottle Label Approval Rev A 03 19
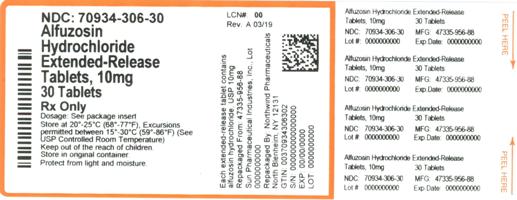
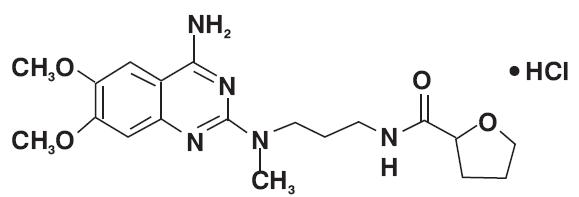
NDC: 70934-306-30 is a prescription drug. Its name is zZosin Hydrochloride and it is an extended-release tablet of 10mg strength, with a total count of 30 tablets. The manufacturer's name is not available from the text obtained by .*