Montelukast Sodium
Product Images NDC 70934-485

View Photos of Packaging, Regulatory Labels, and Product Appearance

Product Visual Gallery

This gallery contains 4 technical images submitted to the FDA as part of the official labeling for Montelukast Sodium (NDC 70934-485). Unlike standard consumer photos, these assets often include clinical data figures, molecular chemical structures, and official manufacturer packaging layouts.

As provided by Denton Pharma, Inc. Dba Northwind Pharmaceuticals, these visuals offer a comprehensive scientific overview of the product's physical and chemical identity, aiding pharmacists and researchers in product verification and study.

FDA Label Image

Label (70934 485 30 Master Bottle Label Approval Rev A 05 20)

Label (70934 485 30 Master Bottle Label Approval   Rev A 05 20)
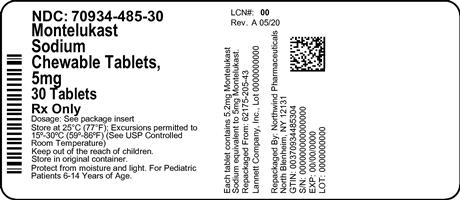
This is a medication package that contains 30 chewable tablets of Montelukast Sodium in 5mg strength. The NDC code for the medication is 70934-485-30. The rest of the text seems to be illegible and contains errors, making it not available for interpretation.*
FDA Label Image

Figure 1 (Montelukast Sodium Tablets And Chewable Tablets 1)

Figure 1 (Montelukast Sodium Tablets And Chewable Tablets 1)
The text describes a chart showing the change in height in centimeters for individuals over a period of weeks on different treatments: Montelukast Sodium 5mg, Beclomethasone 336mcg, and Placebo. The chart displays data for 11 different times, with heights decreasing to a depth of -19 to -16 and increasing to a height of 56. However, there appears to be a typo or garbled text in the label "Sohoanwsno," which is not a recognizable word in English.*
FDA Label Image

Chemical Structure (Montelukast Sodium Tablets And Chewable Tablets 2)

FDA Label Image

Figure 2 (Montelukast Sodium Tablets And Chewable Tablets 3)

Figure 2 (Montelukast Sodium Tablets And Chewable Tablets 3)
This is a graph that appears to show the mean percent change from baseline for a treatment that lasts 15 weeks. The x-axis shows the weeks in the treatment and the y-axis shows the percent change from baseline. There are two lines on the graph, one representing a placebo treatment and the other representing a treatment with Montelukast Sodium.*

* These product label images have been analyzed using experimental machine learning. Please verify findings with the primary label text.