70934 797 30 Master Bottle Label Approval Rev A 03 21
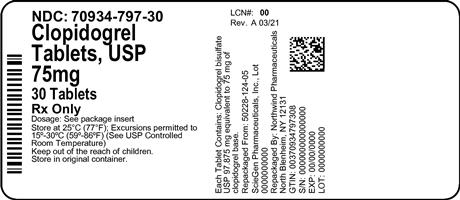
The text indicates the medicine is Clopidogrel, supplied in the form of tablets of 75mg strength containing 30 tablets in a pack. The NDC code printed on the packaging is 70934-797-30. The rest of the text is not legible and hence the description cannot be generated.*