Atorvastatin Calcium
Product Images NDC 70934-841

View Photos of Packaging, Regulatory Labels, and Product Appearance

Product Visual Gallery

This gallery contains 5 technical images submitted to the FDA as part of the official labeling for Atorvastatin Calcium (NDC 70934-841). Unlike standard consumer photos, these assets often include clinical data figures, molecular chemical structures, and official manufacturer packaging layouts.

As provided by Denton Pharma, Inc. Dba Northwind Pharmaceuticals, these visuals offer a comprehensive scientific overview of the product's physical and chemical identity, aiding pharmacists and researchers in product verification and study.

FDA Label Image

70934 841 90 Master Bottle Label Approval Rev A 05 21

70934 841 90 Master Bottle Label Approval   Rev A 05 21
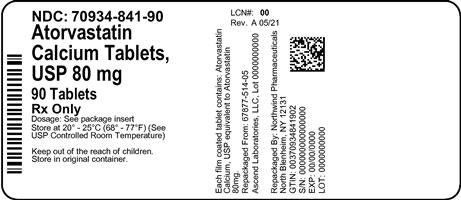
This is a label for Atorvastatin Calcium Tablets, USP 80 mg. It includes the NDC number, which is a unique identifier for drugs in the United States, and the quantity of tablets in the bottle (90). However, the last part of the text is not readable and appears to be gibberish.*
FDA Label Image

Atorvastatin-fig-1 (Atorvastatin Fig 1)

Atorvastatin-fig-1 (Atorvastatin Fig 1)
The text represents a graph showing the cumulative incidence (percentage) over a period of 35 years. Two lines are plotted, one for Atorastatn and one for Placsbo. The graph shows that Atorastatn has a lower cumulative incidence rate than the Placsbo. Additionally, there is information on the hazard ratio (HR=0.64) and p-value (p=0.0005).*
FDA Label Image

Atorvastatin-fig-2 (Atorvastatin Fig 2)

Atorvastatin-fig-2 (Atorvastatin Fig 2)
This is a graph showing the cumulative hazard percentage for a placebo group and a group taking Atorvastatin. The hazard ratio for Atorvastatin compared to placebo is 0.63 with a p-value of 0.001 over a 4-year follow-up period. The X-axis represents the time to the first primary endpoint in years.*
FDA Label Image

Atorvastatin-fig-3 (Atorvastatin Fig 3)

Atorvastatin-fig-3 (Atorvastatin Fig 3)
The given text represents a chart or data table showing the percentage of subjects experiencing a major cardiovascular event when taking Atorvastatin at doses of 10 mg and 80 mg. The chart also displays the hazard ratio with its corresponding confidence interval along with the P-value. The X-axis of the chart shows the time to the first major cardiovascular endpoint in years.*
FDA Label Image

Atorvastatin-st (Atorvastatin St)

* These product label images have been analyzed using experimental machine learning. Please verify findings with the primary label text.