Alendronate Sodium Solution
Product Images NDC 70954-264

View Photos of Packaging, Regulatory Labels, and Product Appearance

Product Visual Gallery

This gallery contains 9 technical images submitted to the FDA as part of the official labeling for Alendronate Sodium (NDC 70954-264). Unlike standard consumer photos, these assets often include clinical data figures, molecular chemical structures, and official manufacturer packaging layouts.

As provided by Ani Pharmaceuticals, Inc., these visuals offer a comprehensive scientific overview of the product's physical and chemical identity, aiding pharmacists and researchers in product verification and study.

FDA Label Image

Study (Study)

Study (Study)
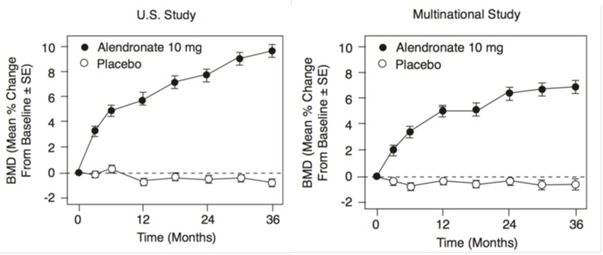
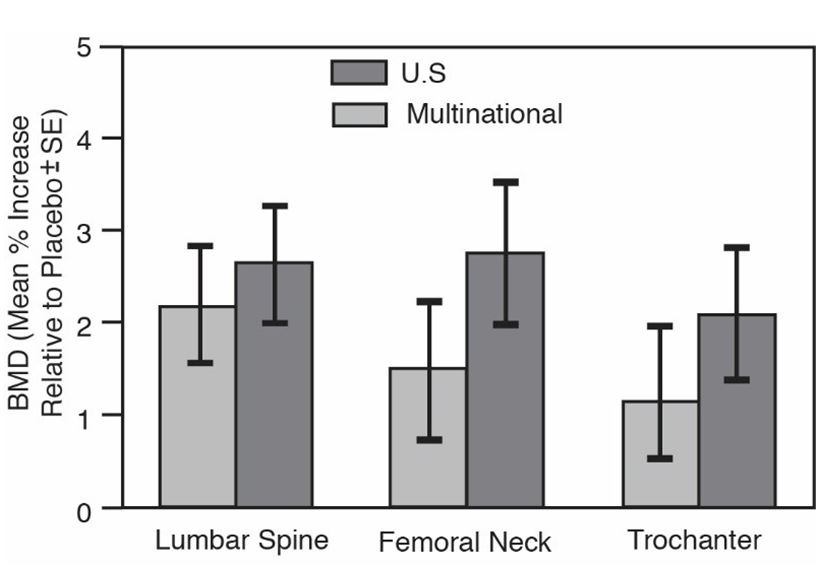
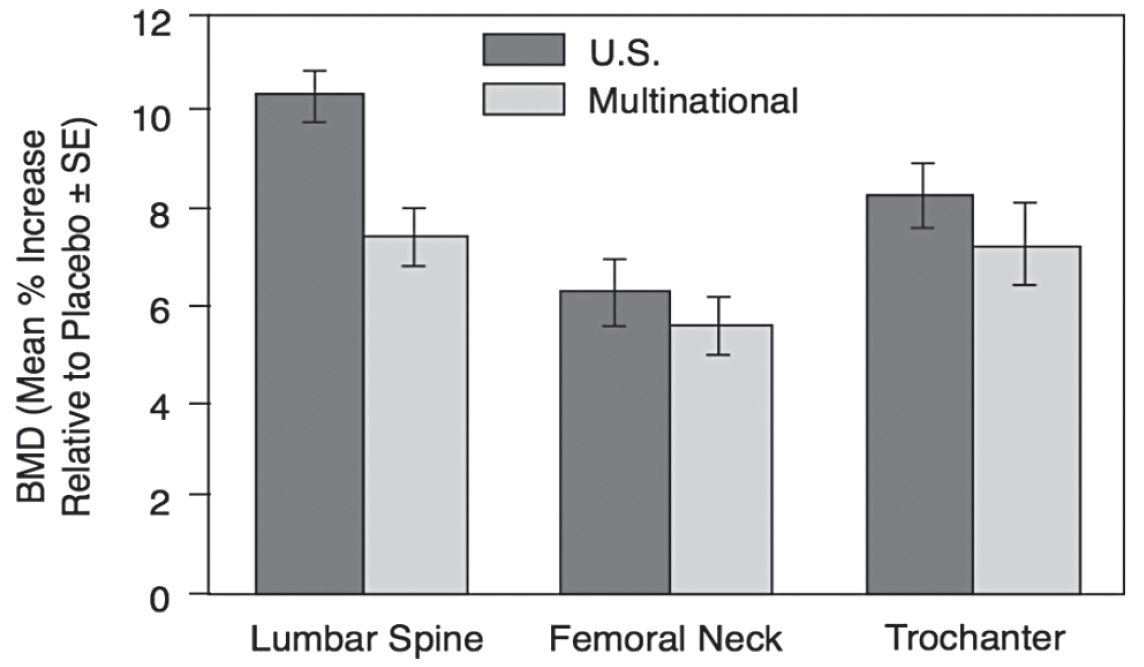
This text appears to be a table describing the percent change in bone mineral density (BMD) from baseline in two studies involving the use of alendronate 10 mg and a placebo over a period of 36 months. The table shows separate results for a U.S. study and a multinational study, with BMD values presented as mean percent change from baseline alongside standard error values. The table also includes a time axis with values in months ranging from 0 to 36.*
FDA Label Image

Carton (Carton)

FDA Label Image

Study-1 (Clinical Study 1)

Study-1 (Clinical Study 1)
This appears to be a table showing the cumulative incidence percentage of a placebo group and an alendronate group over a period of 36 months. It also shows the time in months (up to 36) along the x-axis.*
FDA Label Image

Study-5 (Clinical Study 5)

FDA Label Image

Study-6 (Clinical Study 6)

Study-6 (Clinical Study 6)
This is a report on studies conducted to evaluate the effect of Alendronate 40mg/day versus Placebo or Etidronate 400mg/day on serum alkaline phosphatase level in Paget's Disease of Bone patients. The data presented in the form of a graph shows the mean % change from baseline + SE over a period of 6 months. There were 27 participants in the Placebo group and the data was compared to the Etidronate 400mg/day and Alendronate 40mg/day groups, which included a multinational and a US-based study. The x-axis represents time (in months) from the start of medication while the y-axis represents the mean % change from baseline + SE of serum alkaline phosphatase level.*
FDA Label Image

Container (Container)

Container (Container)
This is a description of Alendronate Sodium Oral Solution, a medication indicated for the treatment of osteoporosis in postmenopausal women, to increase bone mass in men with osteoporosis, and for the treatment of Paget's disease of bone. The text provides information on dosage, storage, and usage instructions for the medication. It also includes the drug's NDC number, manufacturer's information, and lot number.*
FDA Label Image

Figure-2 (Figure2)

Figure-2 (Figure2)
This text indicates statistical information related to bone mineral density (BMD) where a mean % increase is shown in comparison to a placebo, along with the standard error (SE). The data is related to a multinational study that includes measurements of BMD in the Lumbar Spine, Femoral Neck, and Trochanter of patients.*
FDA Label Image

Structure (Structure)

Structure (Structure)
The text is not readable.*
FDA Label Image

Study-4 (Study 4)

Study-4 (Study 4)
This appears to be a table showing mean % change in bone mineral density (BMD) in postmenopausal women over 2- and 3-year studies for alendronate 5mg/day and placebo for the lumbar spine, femoral trochanter, neck, and total body.*

* These product label images have been analyzed using experimental machine learning. Please verify findings with the primary label text.