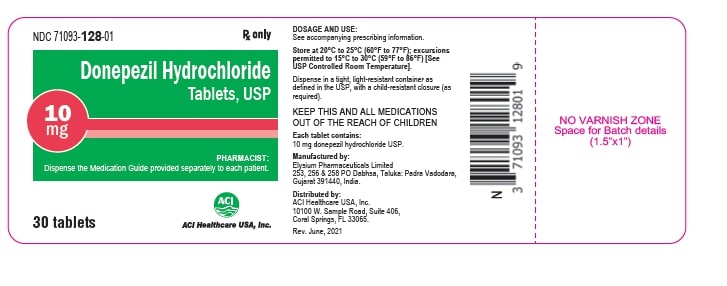
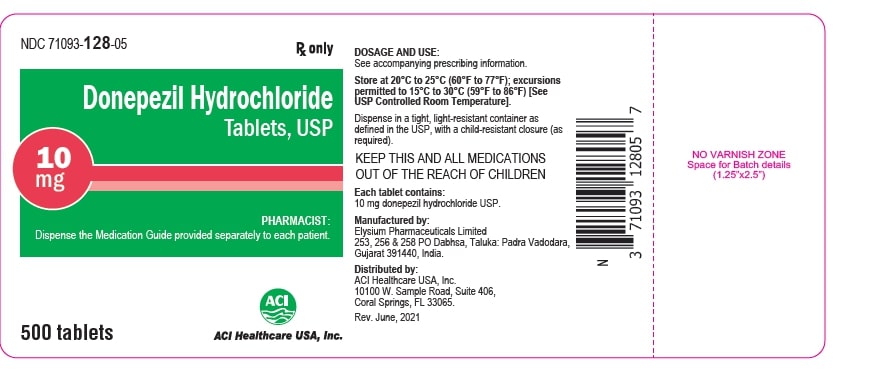
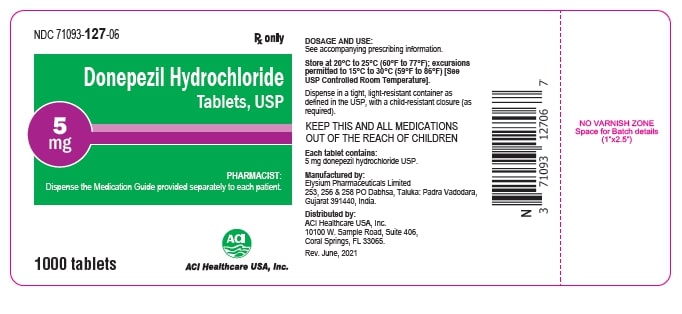
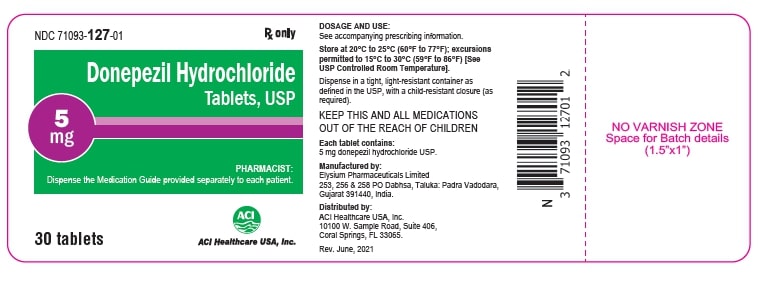
Product Images Donepezil Hydrochloride

View Photos of Packaging, Labels & Appearance

Product Label Images

The following 22 images provide visual information about the product associated with Donepezil Hydrochloride NDC 71093-127 by Aci Healthcare Usa, Inc., such as packaging, labeling, and the appearance of the drug itself. This resource could be helpful for medical professionals, pharmacists, and patients seeking to verify medication information and ensure they have the correct product.

container label-10mg1000s - 10mg 1000s

container label-10mg1000s - 10mg 1000s

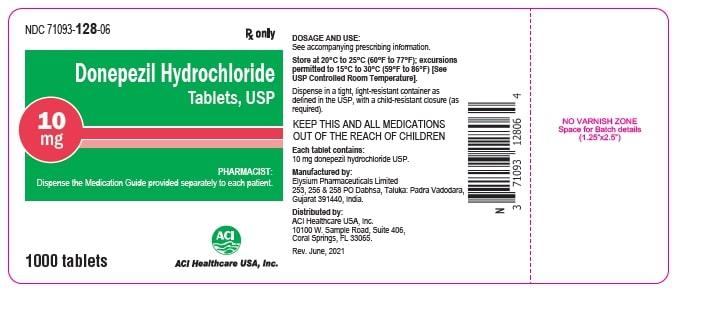
This is a label for Donepezil Hydrochloride tablets, a medication that comes in 2mg and 5mg doses, made by ACH Healthcare USA. The label includes a caution to keep the medication out of reach of children.*

container label-10mg30s - 10mg 30s

container label-10mg30s - 10mg 30s

container label-10mg500s - 10mg 500s

container label-10mg500s - 10mg 500s

container label-10mg90s - 10mg 90s

container label-10mg90s - 10mg 90s

This is a medicine information of Donepezil Hydrochloride Tablets, USP with a total of 90 tablets. The label includes the product code NC710531288 and the manufacturer name "Bonly". There is also a reference to the "NO VARNISH ZONE" and a space to input batch details. The text appears to have been scanned, resulting in some non-readable characters.*

container label-5mg1000s - 5mg 1000s

container label-5mg1000s - 5mg 1000s

container label-5mg30s - 5mg 30s

container label-5mg30s - 5mg 30s

container label-5mg500s - 5mg 500s

container label-5mg500s - 5mg 500s

This is a pharmaceutical label for Donepezil Hydrochloride Tablets, USP produced by the fictitious company, NOCTI0S42745 Ronly. The medication contains 500 tablets and is intended for adults. The label includes the caution to keep the medication out of reach of children.*

container label-5mg90s - 5mg 90s

container label-5mg90s - 5mg 90s

This is a medication label for Donepezil Hydrochloride Tablets, which are used for treating dementia in individuals with Alzheimer's disease. The label includes information for proper usage and storage of the medication.*

Figure 1. Time-course of the Change from Baseline in ADAS-cog Score for Patients Completing 24 Weeks of Treatment. - donepezil fig1

Figure 1. Time-course of the Change from Baseline in ADAS-cog Score for Patients Completing 24 Weeks of Treatment. - donepezil fig1

Figure 10. Cumulative Percentage of Patients Completing 6 Months of Double-blind Treatment with Particular Changes from Baseline in ADCS-ADL-Severe Scores. - donepezil fig10

Figure 10. Cumulative Percentage of Patients Completing 6 Months of Double-blind Treatment with Particular Changes from Baseline in ADCS-ADL-Severe Scores. - donepezil fig10

The text is describing a graph showing the cumulative percentage of patients taking a medication called Donepezil Hydrochloride 10 mg/day compared to a placebo. The graph also shows the change in ADCS-ADL from baseline, with a range from -10 to +5.*

Figure 11. Time-course of the Change from Baseline in SIB Score for Patients Completing 24 Weeks of Treatment. - donepezil fig11

Figure 11. Time-course of the Change from Baseline in SIB Score for Patients Completing 24 Weeks of Treatment. - donepezil fig11

Figure 12. Cumulative Percentage of Patients Completing 24 Weeks of Double-blind Treatment with Specified Changes from Baseline SIB Scores. - donepezil fig12

Figure 12. Cumulative Percentage of Patients Completing 24 Weeks of Double-blind Treatment with Specified Changes from Baseline SIB Scores. - donepezil fig12

The text provides a graph showing the Cumulative Percentage of Patients on the Y-axis and SIB Change from Baseline on the X-axis. The graph has a range of 0-100 on the Y-axis and 0-60 on the X-axis. It appears to be a representation of the distribution of the response to treatment of a particular condition.*

Figure 13. Frequency Distribution of CIBIC-plus Scores at Week 24. - donepezil fig13

Figure 13. Frequency Distribution of CIBIC-plus Scores at Week 24. - donepezil fig13

Figure 2. Cumulative Percentage of Patients Completing 24 Weeks of Double-blind Treatment with Specified Changes from Baseline ADAS-cog Scores. The Percentages of Randomized Patients who Completed the Study were: Placebo 80%, 5 mg/day 85%, and 10 mg/day 68%. - donepezil fig2

Figure 2. Cumulative Percentage of Patients Completing 24 Weeks of Double-blind Treatment with Specified Changes from Baseline ADAS-cog Scores. The Percentages of Randomized Patients who Completed the Study were: Placebo 80%, 5 mg/day 85%, and 10 mg/day 68%. - donepezil fig2

Figure 3. Frequency Distribution of CIBIC-plus Scores at Week 24. - donepezil fig3

Figure 3. Frequency Distribution of CIBIC-plus Scores at Week 24. - donepezil fig3

This is a record of a medical evaluation for patients, indicating a percentage of improvement, and a rating called "CIBIC-plus". However, due to the presence of multiple errors and scattered text fragments, the information is not clear or complete.*

Figure 4. Time-course of the Change from Baseline in ADAS-cog Score for Patients Completing the 15-week Study. - donepezil fig4

Figure 4. Time-course of the Change from Baseline in ADAS-cog Score for Patients Completing the 15-week Study. - donepezil fig4

Figure 5. Cumulative Percentage of Patients with Specified Changes from Baseline ADAS-cog Scores. The Percentages of Randomized Patients Within Each Treatment Group Who Completed the Study Were: Placebo 93%, 5 mg/day 90%, and 10 mg/day 82%. - donepezil fig5

Figure 5. Cumulative Percentage of Patients with Specified Changes from Baseline ADAS-cog Scores. The Percentages of Randomized Patients Within Each Treatment Group  Who  Completed  the  Study  Were:  Placebo  93%,  5  mg/day  90%,  and 10 mg/day 82%. - donepezil fig5

Figure 6. Frequency Distribution of CIBIC-plus Scores at Week 12. - donepezil fig6

Figure 6. Frequency Distribution of CIBIC-plus Scores at Week 12. - donepezil fig6

This appears to be a table displaying the percentage of patients taking different medications and their level of improvement according to the CIBIC-plus rating. The medications listed are Donepezil Hydrochloride at 10mg/day and 5mg/day, as well as a placebo. The table indicates the percentage of patients with varying levels of improvement, ranging from "markedly improved" to "markedly worse."*

Figure 7. Time Course of the Change from Baseline in SIB Score for Patients Completing 6 Months of Treatment. - donepezil fig7

Figure 7. Time Course of the Change from Baseline in SIB Score for Patients Completing 6 Months of Treatment. - donepezil fig7

The text appears to be a table showing the mean change from baseline for clinical improvement after 3 months of drug treatment with either donepezil hydrochloride (10mg/day) or placebo, indicated by symbols (-e- for donepezil and -o- for placebo). However, as there are no corresponding numerical values provided, the information is not complete and cannot be fully interpreted.*

Figure 8. Cumulative Percentage of Patients Completing 6 Months of Double-blind Treatment with Particular Changes from Baseline in SIB Scores. - donepezil fig8

Figure 8. Cumulative Percentage of Patients Completing 6 Months of Double-blind Treatment with Particular Changes from Baseline in SIB Scores. - donepezil fig8

The text represents a chart showing the Cumulative Percentage of Patients treated with Donepezil Hydrochloride 10 mg/day and Placebo, and the SIB (Severe Impairment Battery) Change from Baseline. The chart displays the percentage of patients on the Y-axis, ranging from 0% to 100%, and the SIB Change from Baseline on the X-axis, ranging from 5 to 75. However, there is not enough information to interpret the chart accurately, and no additional context is available.*

Figure 9. Time Course of the Change from Baseline in ADCS-ADL-Severe Score for Patients Completing 6 Months of Treatment. - donepezil fig9

Figure 9. Time Course of the Change from Baseline in ADCS-ADL-Severe Score for Patients Completing 6 Months of Treatment. - donepezil fig9

Chemical Structure - donepezil str

Chemical Structure - donepezil str

* The product label images have been analyzed using a combination of traditional computing and machine learning techniques. It should be noted that the descriptions provided may not be entirely accurate as they are experimental in nature. Use the information in this page at your own discretion and risk.