Clopidogrel Bisulfate
Product Images NDC 71093-142

11 FDA label images from Aci Healthcare Usa, Inc · Packaging, Regulatory Labels, and Product Appearance

Product Visual Gallery

This gallery contains 11 technical images submitted to the FDA as part of the official labeling for Clopidogrel Bisulfate (NDC 71093-142). Unlike standard consumer photos, these assets often include clinical data figures, molecular chemical structures, and official manufacturer packaging layouts.

As provided by Aci Healthcare Usa, Inc, these visuals offer a comprehensive scientific overview of the product's physical and chemical identity, aiding pharmacists and researchers in product verification and study.

FDA Label Image

Image (Ffa4e8bd 1b4f 4c74 9a13 6f95c6cf58bc 01)

Image (Ffa4e8bd 1b4f 4c74 9a13 6f95c6cf58bc 01)
Chemical structure depicting Clopidogrel bisulfate, showing its bicyclic and aromatic rings, ester and sulfur moieties, and sulfonic acid (H2SO4) component as the salt form.*
FDA Label Image

Image (Ffa4e8bd 1b4f 4c74 9a13 6f95c6cf58bc 02)

Image (Ffa4e8bd 1b4f 4c74 9a13 6f95c6cf58bc 02)
A horizontal error bar plot titled 'Effect on active metabolite AUC Mean and 90% confidence interval' showing the change relative to clopidogrel administered alone. It compares four co-administered PPIs: Dexlansoprazole 60 mg, Lansoprazole 30 mg, Pantoprazole 80 mg, and Omeprazole 80 mg, with their mean effect and confidence intervals displayed along the x-axis ranging approximately from 0.4 to 1.4.*
FDA Label Image

Image (Ffa4e8bd 1b4f 4c74 9a13 6f95c6cf58bc 03)

Image (Ffa4e8bd 1b4f 4c74 9a13 6f95c6cf58bc 03)
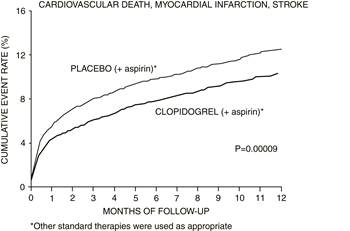
A line graph showing cumulative event rates of cardiovascular death, myocardial infarction, and stroke over 12 months of follow-up. Two lines represent treatment groups: placebo plus aspirin and clopidogrel plus aspirin, with the clopidogrel group showing a lower event rate. The graph includes a statistical significance value (P=0.00009).*
FDA Label Image

Image (Ffa4e8bd 1b4f 4c74 9a13 6f95c6cf58bc 04)

Image (Ffa4e8bd 1b4f 4c74 9a13 6f95c6cf58bc 04)
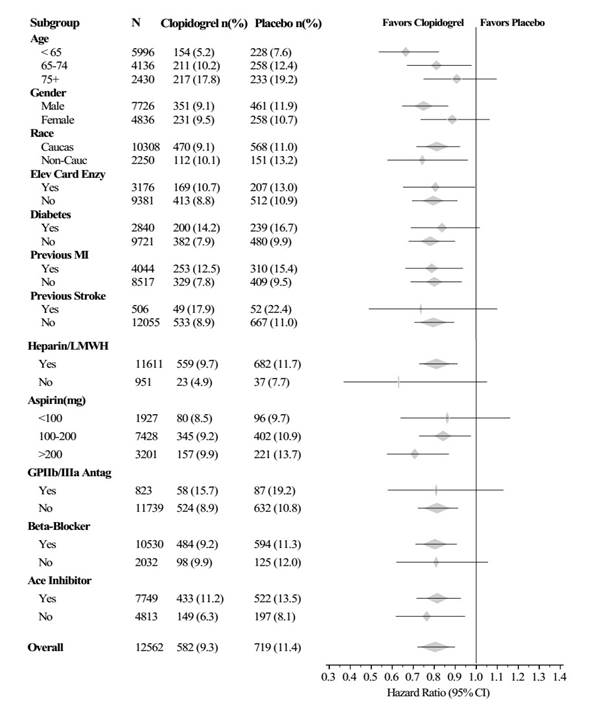
A forest plot chart depicting subgroup analysis of Clopidogrel versus placebo for various demographic and clinical subgroups. The chart shows hazard ratios with 95% confidence intervals for age, gender, race, diabetes status, previous myocardial infarction, stroke, and use of other medications such as Heparin/LMWH, aspirin, GP IIb/IIIa antagonists, beta-blockers, and ACE inhibitors. The plot visualizes treatment effects favoring either Clopidogrel or placebo across these subgroups.*
FDA Label Image

Image (Ffa4e8bd 1b4f 4c74 9a13 6f95c6cf58bc 05)

Image (Ffa4e8bd 1b4f 4c74 9a13 6f95c6cf58bc 05)
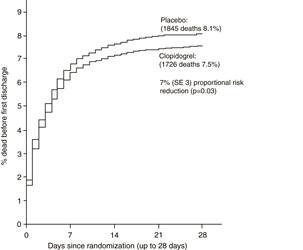
A Kaplan-Meier survival curve chart comparing the percentage of deaths before first discharge over 28 days between patients taking Clopidogrel and a placebo. The y-axis shows the percentage dead, and the x-axis shows days since randomization. The chart demonstrates a proportional risk reduction with Clopidogrel compared to placebo.*
FDA Label Image

Image (Ffa4e8bd 1b4f 4c74 9a13 6f95c6cf58bc 06)

Image (Ffa4e8bd 1b4f 4c74 9a13 6f95c6cf58bc 06)
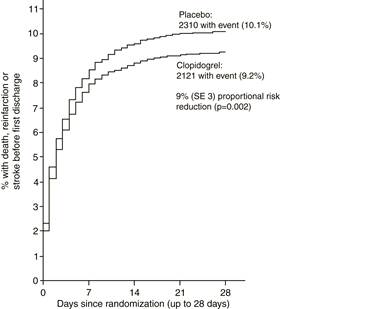
A Kaplan-Meier curve comparing the percentage of patients experiencing stroke, reinfarction, or death over 28 days after randomization between placebo and clopidogrel groups. The graph shows event rates and indicates a 9% proportional risk reduction with clopidogrel versus placebo.*
FDA Label Image

Image (Ffa4e8bd 1b4f 4c74 9a13 6f95c6cf58bc 07)

Image (Ffa4e8bd 1b4f 4c74 9a13 6f95c6cf58bc 07)
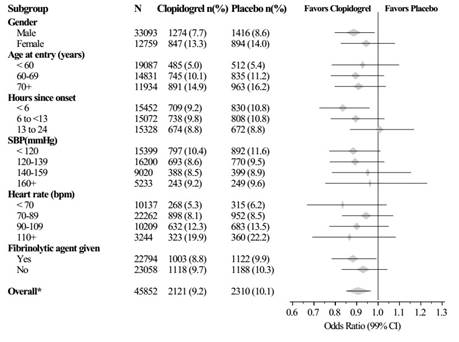
A forest plot presenting odds ratios with 99% confidence intervals comparing Clopidogrel to placebo across various subgroups, including gender, age, hours since onset, systolic blood pressure, heart rate, and fibrinolytic agent use. The plot visually indicates which treatment favors each subgroup.*
FDA Label Image

Image (Ffa4e8bd 1b4f 4c74 9a13 6f95c6cf58bc 08)

Image (Ffa4e8bd 1b4f 4c74 9a13 6f95c6cf58bc 08)
A line graph showing cumulative event rates (%) of fatal or non-fatal vascular events over 36 months of follow-up. The graph compares two treatments labeled ASPIRIN and CLOPIDOGREL, with CLOPIDOGREL showing a lower cumulative event rate than ASPIRIN. The p-value is 0.045, indicating statistical significance in the comparison.*
FDA Label Image

Image (Ffa4e8bd 1b4f 4c74 9a13 6f95c6cf58bc 09)

Image (Ffa4e8bd 1b4f 4c74 9a13 6f95c6cf58bc 09)
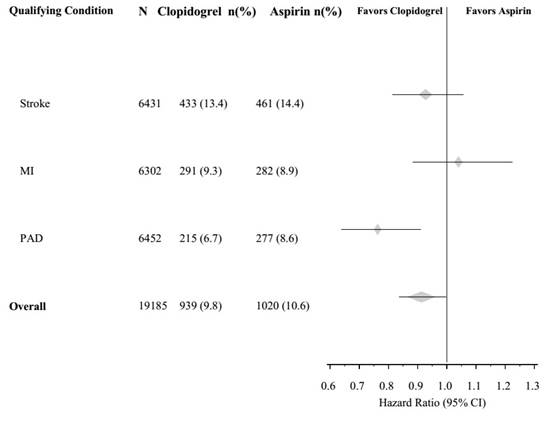
A forest plot chart comparing the hazard ratios (95% confidence intervals) of Clopidogrel versus Aspirin across three qualifying conditions: Stroke, Myocardial Infarction (MI), and Peripheral Artery Disease (PAD), as well as an overall comparison. The chart includes the number of participants and event percentages for each condition, illustrating the relative favorability towards Clopidogrel or Aspirin based on hazard ratios.*
FDA Label Image

90 Count (Ffa4e8bd 1b4f 4c74 9a13 6f95c6cf58bc 10)

90 Count (Ffa4e8bd 1b4f 4c74 9a13 6f95c6cf58bc 10)
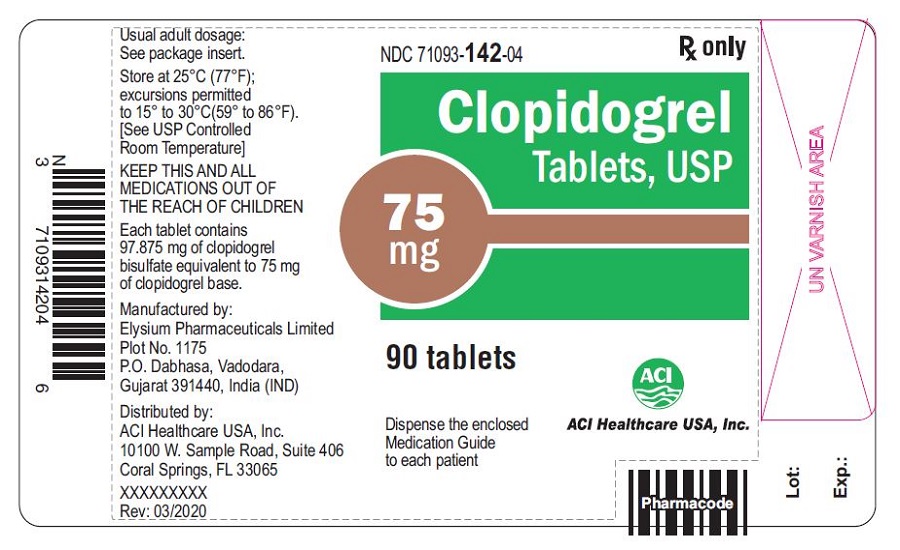
Label for Clopidogrel Tablets, USP 75 mg, distributed by ACI Healthcare USA, Inc. The label states a quantity of 90 tablets and includes storage instructions and manufacturer information (Elysium Pharmaceuticals Limited, India). It shows the NDC 71093-142 and includes caution to keep medications out of children's reach.*
FDA Label Image

500 Count (Ffa4e8bd 1b4f 4c74 9a13 6f95c6cf58bc 11)

500 Count (Ffa4e8bd 1b4f 4c74 9a13 6f95c6cf58bc 11)
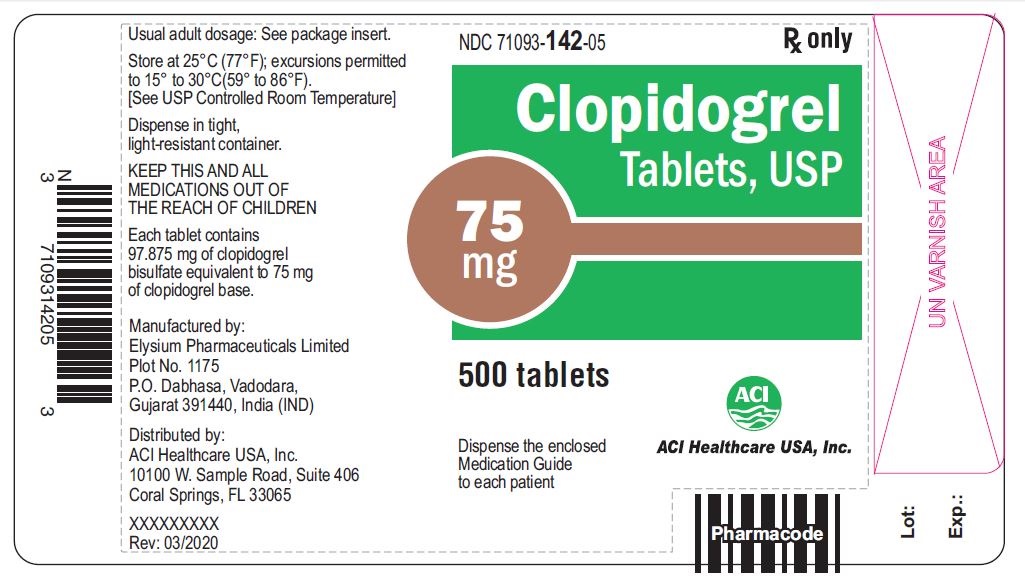
Label for Clopidogrel Tablets USP 75 mg, containing 500 tablets, distributed by ACI Healthcare USA, Inc. The label shows dosage information, storage conditions, and manufacturer details as Elysium Pharmaceuticals Limited, India. It includes a barcode and is marked Rx only.*

* About these descriptions: Image descriptions on this page are generated by automated AI analysis of the product label images from the manufacturer's FDA label submission (SPL). They are provided for reference only and may contain errors or omissions. Always rely on the printed label itself and the official FDA labeling, and consult a pharmacist or healthcare professional with any questions about this product.