Ipratropium Bromide And Albuterol Sulfate
Product Images NDC 71152-201

View Photos of Packaging, Regulatory Labels, and Product Appearance

Product Visual Gallery

This gallery contains 6 technical images submitted to the FDA as part of the official labeling for Ipratropium Bromide And Albuterol Sulfate (NDC 71152-201). Unlike standard consumer photos, these assets often include clinical data figures, molecular chemical structures, and official manufacturer packaging layouts.

As provided by Medical Supply Distribution, Llc., these visuals offer a comprehensive scientific overview of the product's physical and chemical identity, aiding pharmacists and researchers in product verification and study.

FDA Label Image

Image Description (Chem 1)

Image Description (Chem 1)
Chemical structure diagram showing two molecular structures side by side. On the left is the chemical structure of albuterol sulfate, and on the right is the chemical structure of ipratropium bromide. Both structures include skeletal formulas with labeled atoms and functional groups as typically depicted in chemical notation.*

FDA Label Image

Image Description (Fig1)

Image Description (Fig1)
An instructional illustration labeled Figure 1 showing a nebulizer medicine cup being filled with medication from a dropper bottle. The illustration emphasizes preparation steps for using a nebulizer device.*
FDA Label Image

Image Description (Fig2)

Image Description (Fig2)
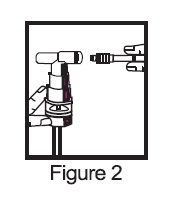
An instructional illustration labeled 'Figure 2' showing a hand holding an inhaler device while a spray or mist is emitted from the device's nozzle.*
FDA Label Image

Image Description (Fig3)

Image Description (Fig3)
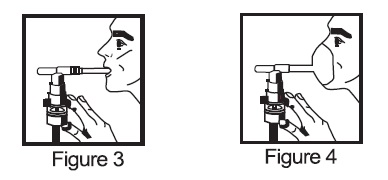
Instructional illustration showing two figures demonstrating the use of a metered dose inhaler (MDI) with a spacer. Figure 3 depicts a person inhaling directly from the MDI mouthpiece. Figure 4 shows the person inhaling through a spacer attached to the MDI spray mouthpiece.*
FDA Label Image

Image Description (Mean)

Image Description (Mean)
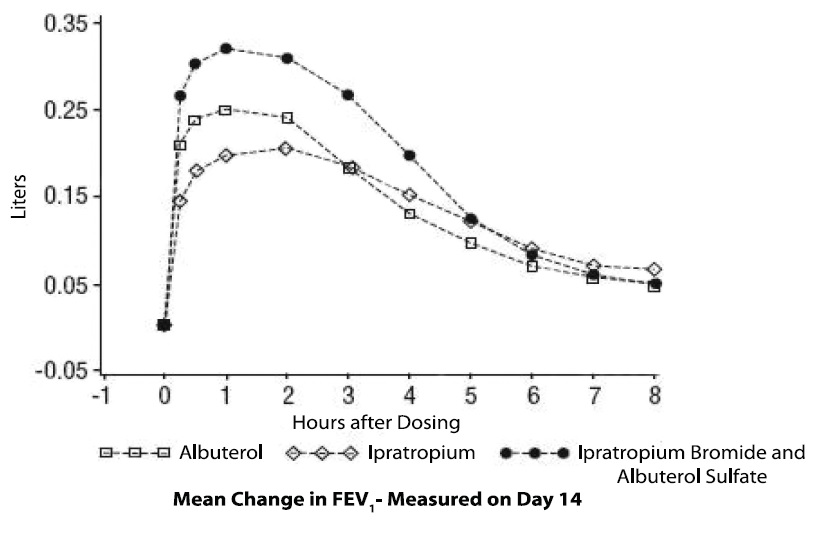
Line graph depicting the mean change in FEV1 in liters over 8 hours after dosing, measured on day 14 for Ipratropium Bromide and Albuterol Sulfate compared to Albuterol and Ipratropium separately. The x-axis represents hours after dosing, and the y-axis shows liters change in FEV1. Three lines illustrate the comparison among the three treatments.*
FDA Label Image

Image Description (Ipatbro1)

Image Description (Ipatbro1)
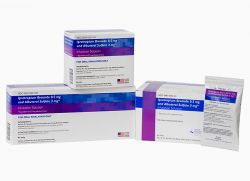
Packaging of Ipratropium Bromide and Albuterol Sulfate inhalation solution. The boxes and one foil pouch are shown, featuring a blue and purple design with white background. The labeler is Medical Supply Distribution, Llc. The packaging includes the product name and dosage information.*

* About these descriptions: Image descriptions on this page are generated by automated AI analysis of the product label images from the manufacturer's FDA label submission (SPL). They are provided for reference only and may contain errors or omissions. Always rely on the printed label itself and the official FDA labeling, and consult a pharmacist or healthcare professional with any questions about this product.