Figure 1 (Alendronate Fig1)
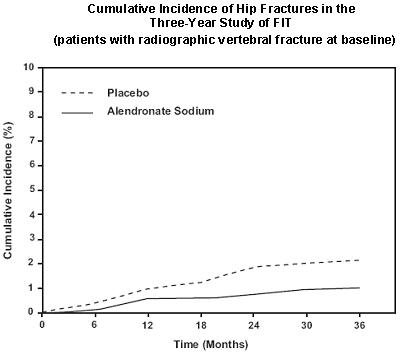
The text describes a chart or graph that shows the cumulative incidence of hip fractures over a three-year study. The study includes patients who had radiographic vertebral fracture at the beginning of the study. The data compares a placebo group to a group taking alendronate sodium. The x-axis shows time in months and the y-axis shows the percentage of cumulative incidence.*