Sildenafil Citrate Tablet, Film Coated
Product Images NDC 71205-231

12 FDA label images from Proficient Rx Lp · Packaging, Regulatory Labels, and Product Appearance

Product Visual Gallery

This gallery contains 12 technical images submitted to the FDA as part of the official labeling for Sildenafil Citrate (NDC 71205-231). Unlike standard consumer photos, these assets often include clinical data figures, molecular chemical structures, and official manufacturer packaging layouts.

As provided by Proficient Rx Lp, these visuals offer a comprehensive scientific overview of the product's physical and chemical identity, aiding pharmacists and researchers in product verification and study.

FDA Label Image

Image (716719c3 C2ab 40c8 A321 6f6ecc0a5315 01)

Image (716719c3 C2ab 40c8 A321 6f6ecc0a5315 01)
Chemical structure diagram of Sildenafil, showing its molecular framework with labeled chemical groups including amide, sulfonyl, and piperazine components.*
FDA Label Image

Image (716719c3 C2ab 40c8 A321 6f6ecc0a5315 02)

Image (716719c3 C2ab 40c8 A321 6f6ecc0a5315 02)
A line graph showing mean change from baseline in sitting systolic blood pressure over a 24-hour period in healthy volunteers. It compares two treatments: Sildenafil 100 mg and placebo, with time post dose in hours on the x-axis and systolic blood pressure change in mmHg on the y-axis.*
FDA Label Image

Image (716719c3 C2ab 40c8 A321 6f6ecc0a5315 03)

Image (716719c3 C2ab 40c8 A321 6f6ecc0a5315 03)
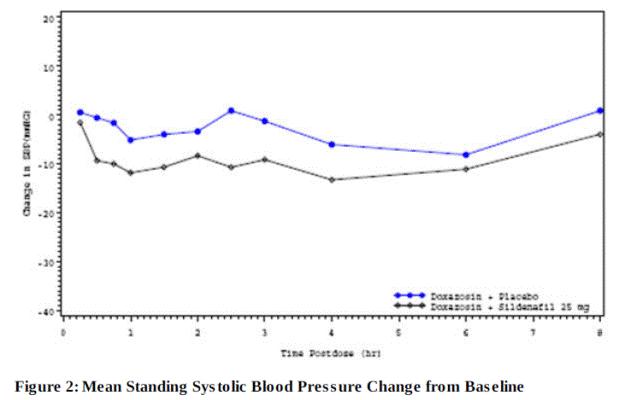
A line graph titled 'Mean Standing Systolic Blood Pressure Change from Baseline' showing change in blood pressure (in mmHg) over 8 hours. Two lines compare Doxazosin plus Placebo and Doxazosin plus Sildenafil 25 mg, illustrating their effects on blood pressure change over time.*
FDA Label Image

Image (716719c3 C2ab 40c8 A321 6f6ecc0a5315 04)

Image (716719c3 C2ab 40c8 A321 6f6ecc0a5315 04)
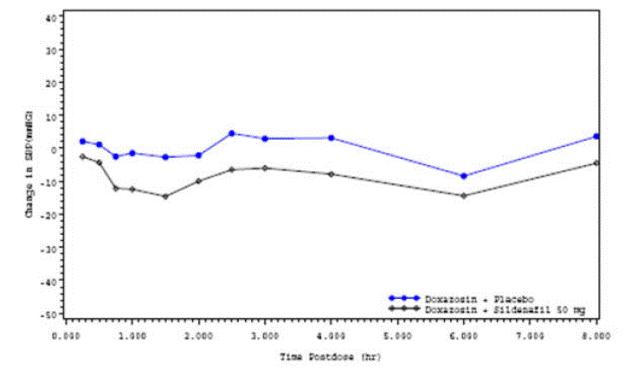
A line graph showing changes in SBP (mmHg) over time post-dose (hours). It compares two treatments: Doxazosin + Placebo and Doxazosin + Sildenafil 50 mg, tracking blood pressure changes up to 8 hours after dosing.*
FDA Label Image

Image (716719c3 C2ab 40c8 A321 6f6ecc0a5315 05)

Image (716719c3 C2ab 40c8 A321 6f6ecc0a5315 05)
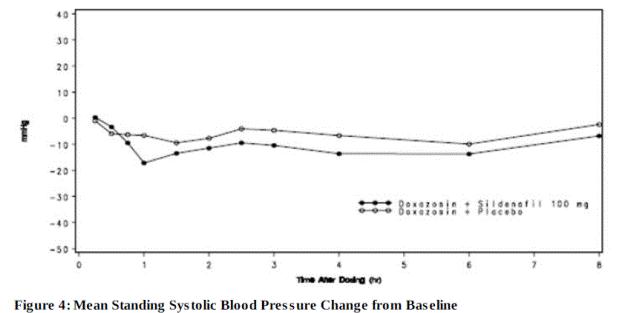
A line graph depicting the mean change in standing systolic blood pressure from baseline over time (hours) after dosing with doxazosin combined with sildenafil 100 mg or placebo. The X-axis represents time in hours, while the Y-axis shows blood pressure change in mmHg, with data points for each treatment group.*
FDA Label Image

Image (716719c3 C2ab 40c8 A321 6f6ecc0a5315 06)

Image (716719c3 C2ab 40c8 A321 6f6ecc0a5315 06)
A line graph showing mean plasma concentrations of Sildenafil over time in healthy male volunteers after oral administration. The x-axis represents time post dose in hours, ranging from 0 to 24 hours. The y-axis shows plasma concentration in ng/mL, ranging from 0 to 500. The graph depicts a concentration peak shortly after dosing, followed by a gradual decline over 24 hours, for the treatment labeled as Commercial Tablet.*
FDA Label Image

Image (716719c3 C2ab 40c8 A321 6f6ecc0a5315 07)

Image (716719c3 C2ab 40c8 A321 6f6ecc0a5315 07)
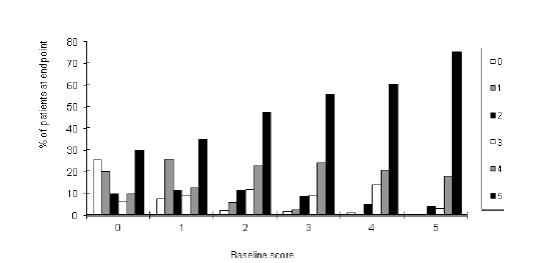
Bar graph showing the distribution of patients by baseline score and percentage at endpoint, with multiple categories represented by bars of different shading or color codes. The x-axis is labeled 'Baseline score' and the y-axis 'percentage of patients at endpoint.'*
FDA Label Image

Image (716719c3 C2ab 40c8 A321 6f6ecc0a5315 08)

Image (716719c3 C2ab 40c8 A321 6f6ecc0a5315 08)
A bar chart showing the percentage of patients at endpoint on the vertical axis against baseline scores on the horizontal axis from 0 to 5. Multiple bars in different shades represent categories labeled 0 through 5 in the legend. The chart visualizes data distribution across baseline scores and categories.*
FDA Label Image

Image (716719c3 C2ab 40c8 A321 6f6ecc0a5315 09)

Image (716719c3 C2ab 40c8 A321 6f6ecc0a5315 09)
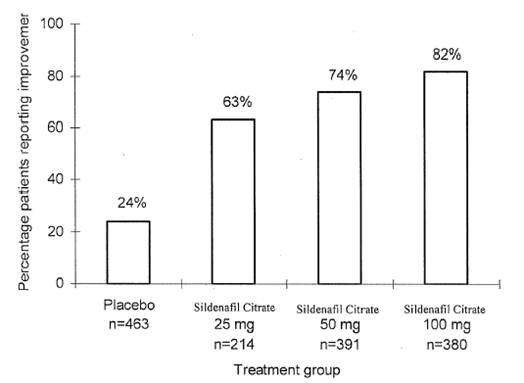
A bar chart depicting the percentage of patients reporting improvement across four treatment groups: placebo (24%), Sildenafil Citrate 25 mg (63%), Sildenafil Citrate 50 mg (74%), and Sildenafil Citrate 100 mg (82%). The x-axis shows the treatment groups with patient numbers, and the y-axis displays the percentage of patients reporting improvement from 0 to 100%.*
FDA Label Image

Image (716719c3 C2ab 40c8 A321 6f6ecc0a5315 10)

FDA Label Image

Image (716719c3 C2ab 40c8 A321 6f6ecc0a5315 11)

FDA Label Image

71205-231-10 (716719c3 C2ab 40c8 A321 6f6ecc0a5315 12)

71205-231-10 (716719c3 C2ab 40c8 A321 6f6ecc0a5315 12)
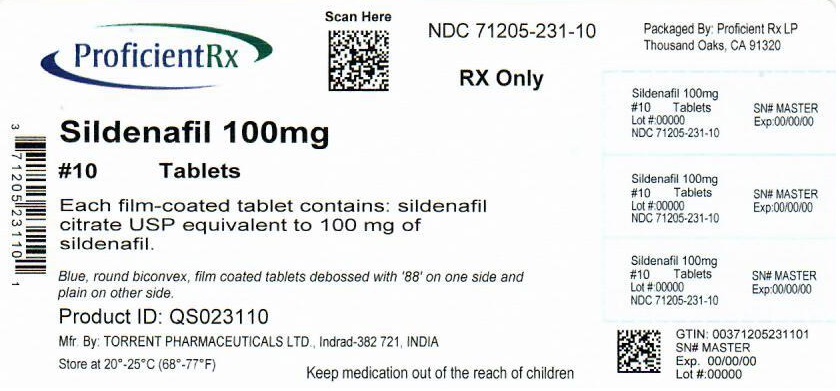
Sildenafil 100 mg film-coated tablets label from Proficient Rx LP. The label specifies a package of 10 tablets, each containing sildenafil citrate USP equivalent to 100 mg sildenafil. Describes tablet appearance as blue, round, biconvex, and debossed with '88' on one side. Manufacturer is Torrent Pharmaceuticals Ltd., India. Includes storage temperature and barcode.*

* About these descriptions: Image descriptions on this page are generated by automated AI analysis of the product label images from the manufacturer's FDA label submission (SPL). They are provided for reference only and may contain errors or omissions. Always rely on the printed label itself and the official FDA labeling, and consult a pharmacist or healthcare professional with any questions about this product.