Pregabalin Capsule
Product Images NDC 71205-556

View Photos of Packaging, Regulatory Labels, and Product Appearance

Product Visual Gallery

This gallery contains 14 technical images submitted to the FDA as part of the official labeling for Pregabalin (NDC 71205-556). Unlike standard consumer photos, these assets often include clinical data figures, molecular chemical structures, and official manufacturer packaging layouts.

As provided by Proficient Rx Lp, these visuals offer a comprehensive scientific overview of the product's physical and chemical identity, aiding pharmacists and researchers in product verification and study.

FDA Label Image

71205-556-30 (Pregabalin Caps 50mg 30s Count)

71205-556-30 (Pregabalin Caps 50mg 30s Count)
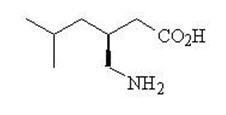
This is a medication called Pregabalin with a dosage of 50mg per capsule. The medication comes in a package with 30 capsules with a serial number and a lot number. The medication guide should be provided to each patient. The medication is white to off-white powder, filled in size "3" hard gelatin capsules with a white opaque colored cap and body. The cap has an imprint of "SG," and the body has an imprint of "#30 Capsules SNAMASTER 351" with black ink. The product is made by ScieGen Pharmaceuticals, Inc. and packed by Proficient Rx LP in Thousand Oaks, CA. The medication should be stored at 25°C (77°F), and the lot number provided is 00000.*
FDA Label Image

Figure 1 (Pregabalin Fig01)

FDA Label Image

Figure 2 (Pregabalin Fig02)

FDA Label Image

Figure 3 (Pregabalin Fig03)

Figure 3 (Pregabalin Fig03)
This text appears to be a table or chart containing medication dosages and results for patients' pain improvement. The top section shows different dosages for three different medications (Pregatalin, Pregabain, and Pregabalin) taken multiple times per day. The bottom section displays the percentage of improvement in pain for patients compared to their baseline pain levels. However, the text is not fully legible and there may be some errors in the result.*
FDA Label Image

Figure 4 (Pregabalin Fig04)

FDA Label Image

Figure 5 (Pregabalin Fig05)

FDA Label Image

Figure 6 (Pregabalin Fig06)

FDA Label Image

Figure 7 (Pregabalin Fig07)

FDA Label Image

Figure 9 (Pregabalin Fig08)

Figure 9 (Pregabalin Fig08)
The text provides a graph presenting the percentage of patients improvement with two different doses of Pregabalin - 300mg and 450mg, as well as a placebo, in comparison to the baseline pain. There is no further information available to provide a more useful description.*
FDA Label Image

Figure 10 (Pregabalin Fig09)

Figure 10 (Pregabalin Fig09)
This appears to be a chart with different subject percentages on the y-axis and days on the x-axis, labeled with two treatments: "Progabain" and "Placebo." However, without further context or information, it is not possible to determine the specifics of the study or what the percentages represent.*
FDA Label Image

Figure 11 (Pregabalin Fig10)

Figure 11 (Pregabalin Fig10)
The text provided is describing a chart or data representation that shows the percentage of subjects improved from Bassin to week 12 based on BOCF. The actual percentages are not available as the text only contains symbols and letters that do not form coherent words or numbers.*
FDA Label Image

Figure 12 (Pregabalin Fig11)

FDA Label Image

Cockcroft And Gault Equation (Pregabalin Formula)

Cockcroft And Gault Equation (Pregabalin Formula)
This appears to be a formula for calculating creatinine clearance (CLCT) for patients based on their age, weight, and serum creatinine level. However, the value for "mmmmmmmmm e e" is not readable and may have been incorrectly translated by the . Therefore, the formula is not entirely complete and may not be usable without additional context or information.*
FDA Label Image

Chemical Structure (Pregabalin Str)

* These product label images have been analyzed using experimental machine learning. Please verify findings with the primary label text.