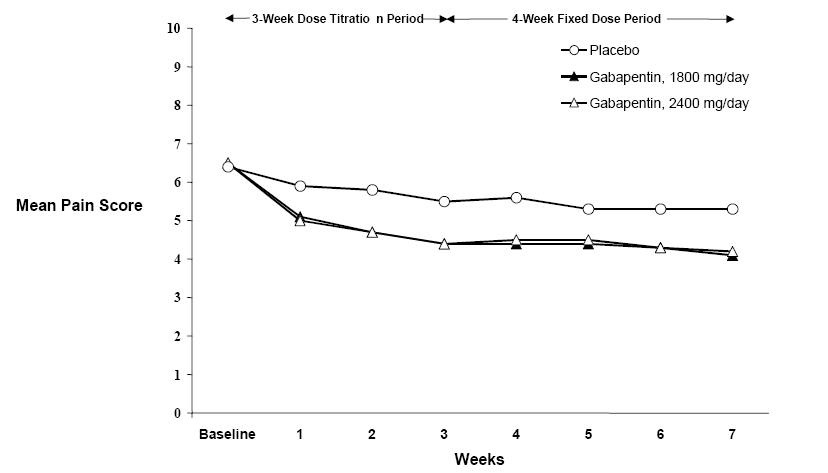
Gaba-fig-1-jpg.jpg (Gaba Fig 1 Jpg)

This appears to be a chart or graph depicting the mean pain score for a study with a 4-week dose titration period followed by a 4-week fixed dose period for a placebo and Gabapentin at 3600 mg/day. The pain score is measured over 4 weeks, with baseline and weeks 1-4 labeled on the horizontal axis. Without more context or information, the chart's purpose or application is not clear.*