Gabapentin Capsule
Product Images NDC 71205-671

View Photos of Packaging, Regulatory Labels, and Product Appearance

Product Visual Gallery

This gallery contains 7 technical images submitted to the FDA as part of the official labeling for Gabapentin (NDC 71205-671). Unlike standard consumer photos, these assets often include clinical data figures, molecular chemical structures, and official manufacturer packaging layouts.

As provided by Proficient Rx Lp, these visuals offer a comprehensive scientific overview of the product's physical and chemical identity, aiding pharmacists and researchers in product verification and study.

FDA Label Image

71205-671-72 (Gabapentin 400mg 30s)

71205-671-72 (Gabapentin 400mg 30s)
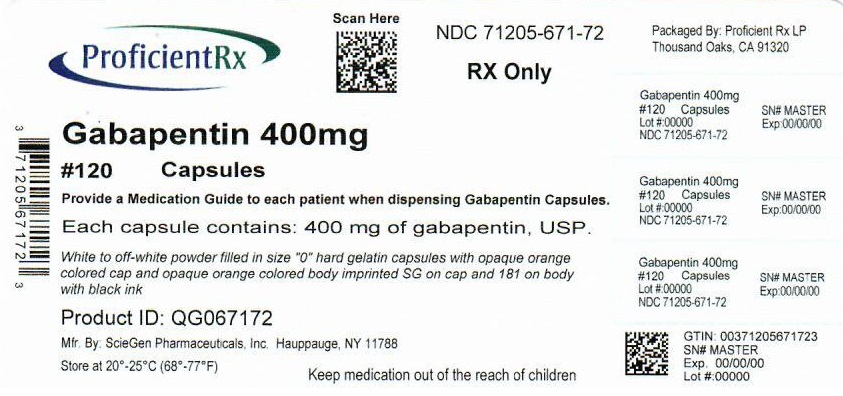
This is a prescription drug packaging for Gabapentin capsules. It is manufactured by ScieGen Pharmaceuticals, Inc. with a dosage of 400mg per capsule. The package includes 120 capsules with the identifier numbers SN# MASTER, Lo1#00060, and NDC 71205-671-72. The capsules are off-white with opaque orange-colored bodies and caps, labeled "SG" and "181" respectively. The packaging also recommends providing a medication guide to each patient upon dispensing. The lot number is #00000 and the expiration date is not clearly specified, likely obscured by errors.*
FDA Label Image

Figure 1 (Image 01)

Figure 1 (Image 01)
This appears to be a chart or table heading related to pain management. It mentions mean pain score and different doses/treatments such as placebo and gabapentin. It also seems to have a baseline and track data over several weeks. However, without further context or information it is difficult to provide a more specific or detailed description.*
FDA Label Image

Figure 2 (Image 02)

Figure 2 (Image 02)
This is a graph that shows the mean pain score over a 7-week fixed dose period of a drug. Four different doses were tested: a placebo and gabapentin doses of 1800 mg/day, 2400 mg/day, and an unknown dose. The graph indicates the pain was measured at baseline and weeks 1 through 7.*
FDA Label Image

Figure 3 (Image 03)

FDA Label Image

Cockcroft And Gault Equation (Image 04)

FDA Label Image

Gabapentin Structural Formula (Image 05)

FDA Label Image

Image-09 (Image 09)

* These product label images have been analyzed using experimental machine learning. Please verify findings with the primary label text.