Pemetrexed Injection, Powder, Lyophilized, For Solution
Product Images NDC 71288-167

View Photos of Packaging, Regulatory Labels, and Product Appearance

Product Visual Gallery

This gallery contains 15 technical images submitted to the FDA as part of the official labeling for Pemetrexed (NDC 71288-167). Unlike standard consumer photos, these assets often include clinical data figures, molecular chemical structures, and official manufacturer packaging layouts.

As provided by Meitheal Pharmaceuticals Inc., these visuals offer a comprehensive scientific overview of the product's physical and chemical identity, aiding pharmacists and researchers in product verification and study.
FDA Label Image
FDA Label Image

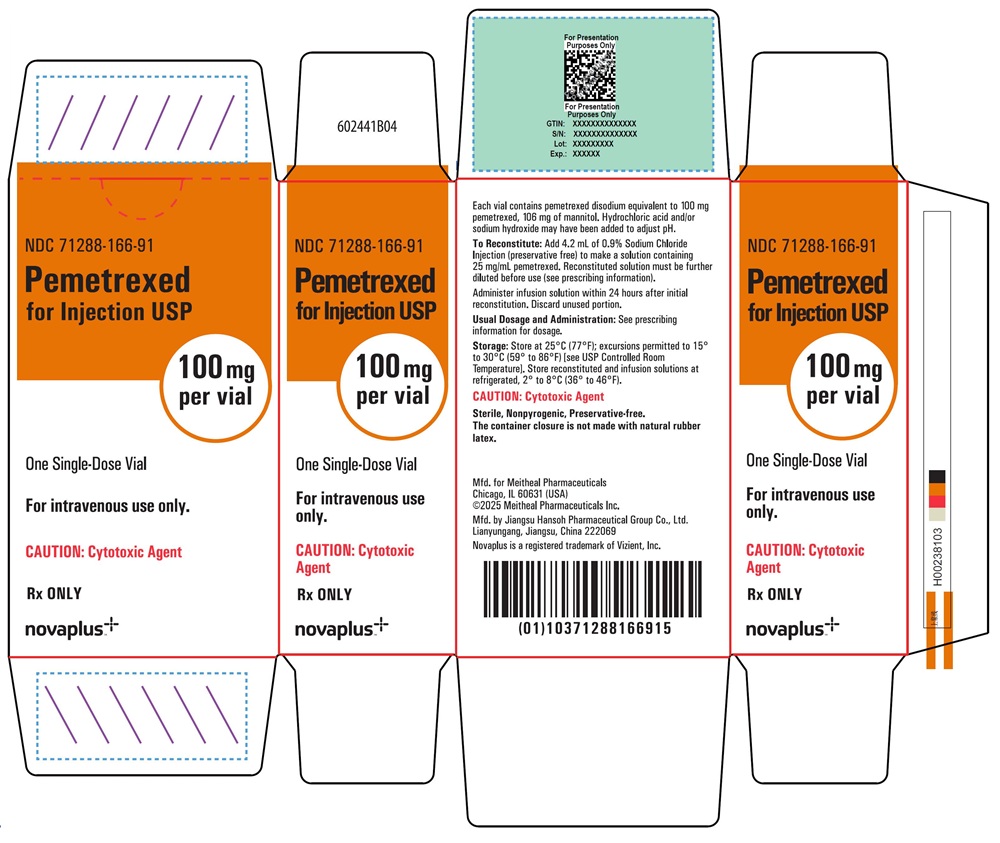
Principal Display Panel – Pemetrexed For Injection, Usp 100 mg Carton (Pem Hansoh 100mg Carton Np V4)

Principal Display Panel – Pemetrexed For Injection, Usp 100 mg Carton (Pem Hansoh 100mg Carton Np V4)
The packaging label for Pemetrexed for Injection USP 100 mg per vial, a lyophilized powder injection for intravenous use by Meitheal Pharmaceuticals Inc. The label includes warnings for cytotoxicity, usage instructions, storage conditions, and proprietary branding as novaplus. It specifies one single-dose vial and highlights the route of administration and reconstitution details.*
FDA Label Image

Principal Display Panel – Pemetrexed For Injection, Usp 100 mg Vial Label (Pem Hansoh 100mg Vial Np V2)

Principal Display Panel – Pemetrexed For Injection, Usp 100 mg Vial Label (Pem Hansoh 100mg Vial Np V2)
Label for Pemetrexed for Injection USP 100 mg per vial, a lyophilized powder for intravenous injection. The label indicates a single-dose vial, cytotoxic agent, manufactured for Meitheal Pharmaceuticals in Chicago, IL, and made in China. It includes storage instructions and cautions for use.*
FDA Label Image

Principal Display Panel – Pemetrexed For Injection, Usp 500 mg Carton (Pem Hansoh 500mg Carton Np V4)

Principal Display Panel – Pemetrexed For Injection, Usp 500 mg Carton (Pem Hansoh 500mg Carton Np V4)
Pemetrexed for Injection USP 500 mg per vial carton for a single-dose vial. The lyophilized powder is for intravenous use only and labeled as a cytotoxic agent. The packaging is from Meitheal Pharmaceuticals Inc. and includes handling instructions, reconstitution directions, and storage conditions.*
FDA Label Image

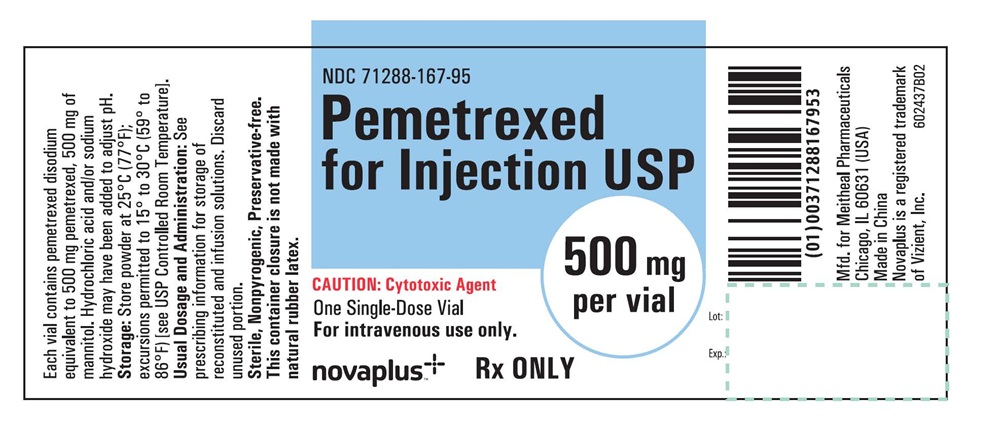
Principal Display Panel – Pemetrexed For Injection, Usp 500 mg Vial Label (Pem Hansoh 500mg Vial Np V2)

Principal Display Panel – Pemetrexed For Injection, Usp 500 mg Vial Label (Pem Hansoh 500mg Vial Np V2)
Label for Pemetrexed for Injection USP, 500 mg per vial, lyophilized powder for solution. The label includes NDC 71288-167-95 and states it is a single-dose vial for intravenous use only. It is produced by Meitheal Pharmaceuticals Inc., with manufacturing in China for Novaplus. The label notes it is preservative-free, nonpyrogenic, and contains no natural rubber latex.*
FDA Label Image

Figure 3 (Pem Hansoh Np Fig 3)

Figure 3 (Pem Hansoh Np Fig 3)
A survival curve chart comparing survival probability over time (months) for two treatment groups: Pemetrexed plus Cisplatin (PC) and Gemcitabine plus Cisplatin (GC). The x-axis represents survival time in months up to 30, and the y-axis represents survival probability from 0 to 1. Patient risk numbers at various time points are listed below the graph for both groups.*
FDA Label Image

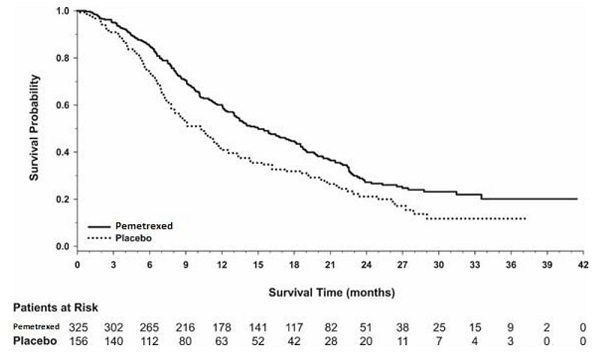
Figure 6 (Pem Hansoh Np Fig 6)

Figure 6 (Pem Hansoh Np Fig 6)
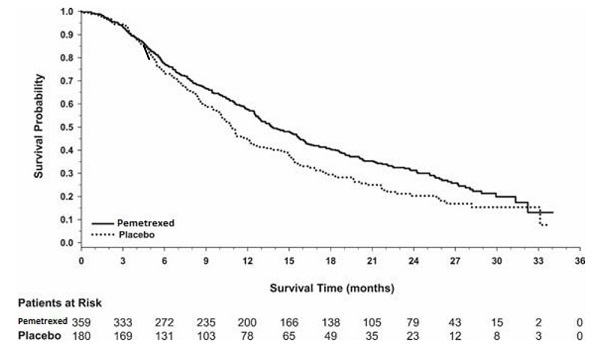
A survival curve chart comparing survival probability over time (months) between Pemetrexed and placebo groups. The solid line represents Pemetrexed, and the dotted line represents placebo, showing survival probability on the y-axis and survival time in months on the x-axis. Patient numbers at risk for each group are listed below the graph at various time points.*
FDA Label Image

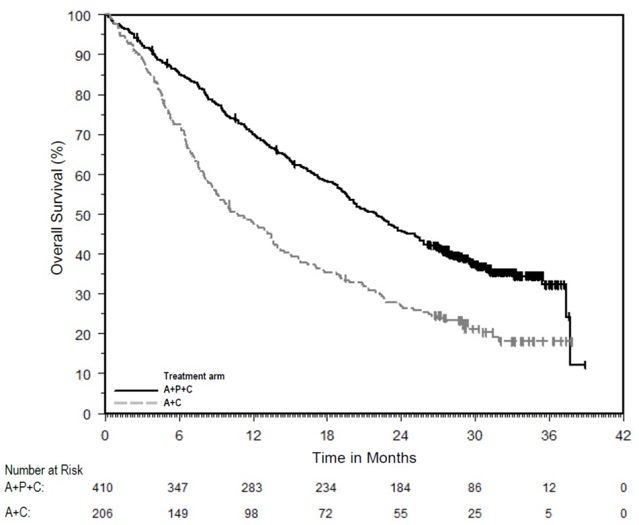
Figure 1 (Pem Hansoh Np Fig1)

Figure 1 (Pem Hansoh Np Fig1)
A Kaplan-Meier survival curve comparing overall survival percentages over time in months between two treatment arms labeled A+P+C and A+C. The chart includes a table showing the number of patients at risk in each group at various time points up to 42 months.*
FDA Label Image

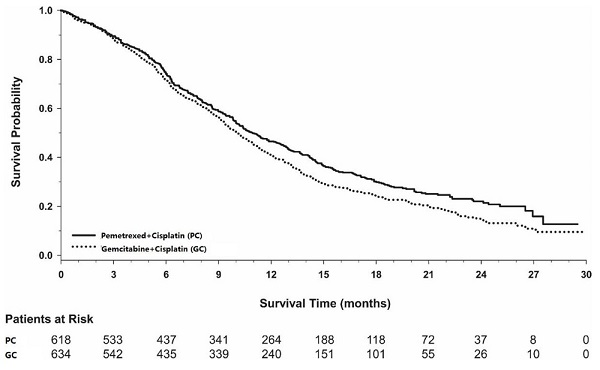
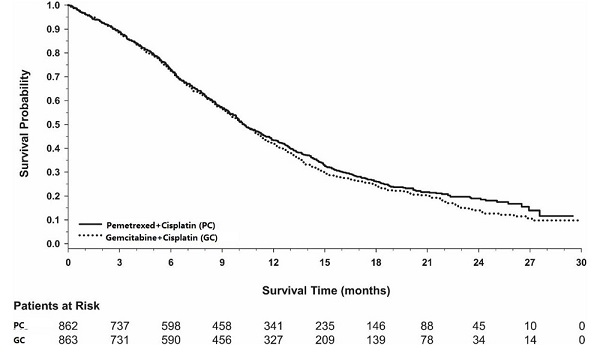
Figure 2 (Pem Hansoh Np Fig2)

Figure 2 (Pem Hansoh Np Fig2)
A Kaplan-Meier survival curve graph comparing overall survival between two treatment groups: Pemetrexed plus Cisplatin (solid line) and Gemcitabine plus Cisplatin (dotted line). The x-axis represents survival time in months (0 to 30), and the y-axis shows survival probability (0.0 to 1.0). Below the graph, a table lists the number of patients at risk at various time points for each group.*
FDA Label Image

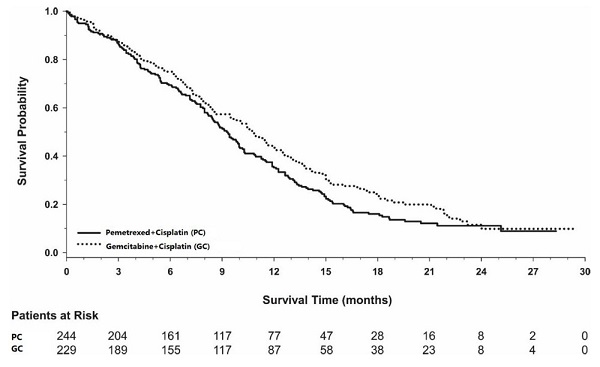
Figure 4 (Pem Hansoh Np Fig4)

Figure 4 (Pem Hansoh Np Fig4)
A Kaplan-Meier survival curve graph comparing survival probability over time (months) between two groups: Pemetrexed plus Cisplatin (PC) and Gemcitabine plus Cisplatin (GC). The graph includes lines representing survival probabilities and a table of patients at risk over time for each group, demonstrating comparative survival outcomes up to 30 months.*
FDA Label Image

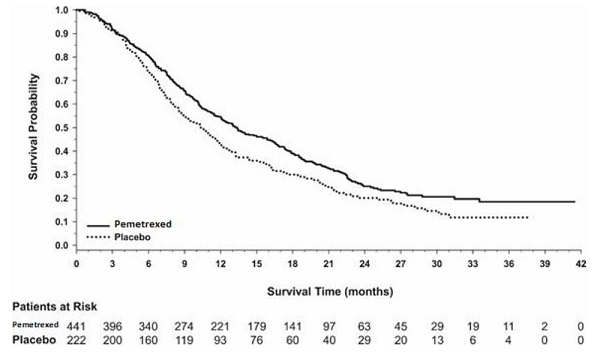
Figure 5 (Pem Hansoh Np Fig5)

Figure 5 (Pem Hansoh Np Fig5)
A survival probability Kaplan-Meier curve comparing Pemetrexed injection versus placebo over a timeline of 0 to 42 months. The graph includes the number of patients at risk for both Pemetrexed and placebo groups at multiple time points along the x-axis.*
FDA Label Image

Figure 7 (Pem Hansoh Np Fig7)

Figure 7 (Pem Hansoh Np Fig7)
A Kaplan-Meier survival curve chart comparing survival probability over time in months between patients treated with Pemetrexed versus placebo. The chart includes survival probabilities on the y-axis and survival time in months on the x-axis, with a table below showing the number of patients at risk over time for both groups.*
FDA Label Image

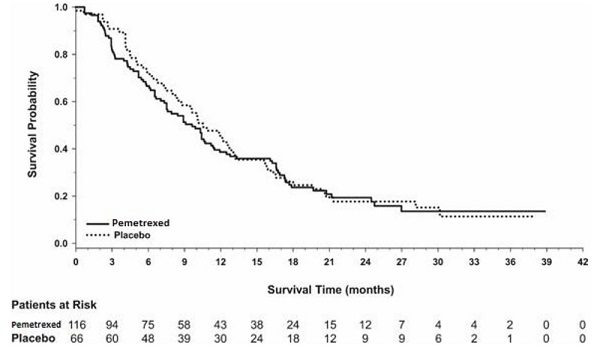
Figure 8 (Pem Hansoh Np Fig8)

Figure 8 (Pem Hansoh Np Fig8)
A Kaplan-Meier survival curve chart comparing survival probability over time (months) between Pemetrexed and placebo treatment groups. The x-axis represents survival time in months, and the y-axis shows survival probability. The chart includes patient numbers at risk for both groups at multiple time points.*
FDA Label Image

Figure 9 (Pem Hansoh Np Fig9)

Figure 9 (Pem Hansoh Np Fig9)
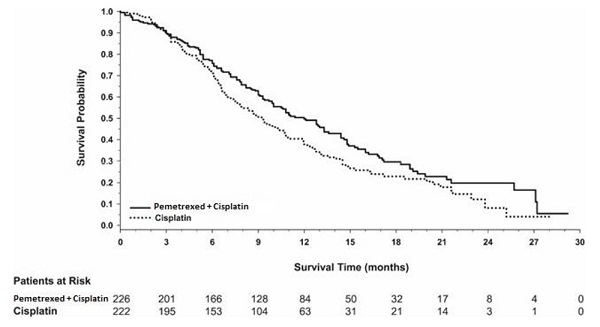
A Kaplan-Meier survival curve comparing survival probabilities over time (in months) between two groups: patients treated with Pemetrexed plus Cisplatin versus Cisplatin alone. The graph includes a table of the number of patients at risk in each group across different time points up to 30 months.*
FDA Label Image

Structural Formula (Pem Hansoh Np Struct V2)

Structural Formula (Pem Hansoh Np Struct V2)
Chemical structure of Pemetrexed disodium heptahydrate, showing its molecular arrangement including a pyrrolopyrimidine ring and multiple carboxylate groups with sodium ions.*

* About these descriptions: Image descriptions on this page are generated by automated AI analysis of the product label images from the manufacturer's FDA label submission (SPL). They are provided for reference only and may contain errors or omissions. Always rely on the printed label itself and the official FDA labeling, and consult a pharmacist or healthcare professional with any questions about this product.