Sildenafil Tablet, Film Coated
Product Images NDC 71335-1028

View Photos of Packaging, Regulatory Labels, and Product Appearance

Product Visual Gallery

This gallery contains 14 technical images submitted to the FDA as part of the official labeling for Sildenafil (NDC 71335-1028). Unlike standard consumer photos, these assets often include clinical data figures, molecular chemical structures, and official manufacturer packaging layouts.

As provided by Bryant Ranch Prepack, these visuals offer a comprehensive scientific overview of the product's physical and chemical identity, aiding pharmacists and researchers in product verification and study.

FDA Label Image

Camberlogo1 (Camberlogo1)

FDA Label Image

Camberlogo2 (Camberlogo2)

FDA Label Image

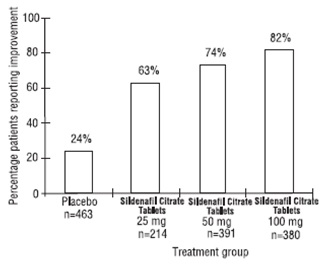
Sildenafilfigure7 (Sildenafilfigure7)

Sildenafilfigure7 (Sildenafilfigure7)
A bar graph showing the percentage of patients reporting improvement across four treatment groups: Placebo, Sildenafil Citrate Tablets 25 mg, 50 mg, and 100 mg. The graph illustrates increasing improvement percentages from placebo through higher doses of Sildenafil Citrate tablets.*
FDA Label Image

Label Image (Lbl713351028)

Label Image (Lbl713351028)
Label for Sildenafil Citrate 50 mg tablet film-coated, packaged by Bryant Ranch Prepack. The label compares the product to Viagra 50 mg tablets by Hetero Labs Limited. It indicates a quantity of 30 tablets, with storage instructions at 20°-25°C (68°-77°F) and a warning to keep drugs out of reach of children. The NDC displayed is 71335-1028-1.*
FDA Label Image

Sildenafilfigure1 (Sildenafilfigure1)

Sildenafilfigure1 (Sildenafilfigure1)
A line graph comparing systolic blood pressure (mmHg) changes over 24 hours post-dose between Sildenafil 100 mg and placebo. The x-axis shows time post-dose in hours, and the y-axis shows systolic blood pressure changes. Two lines represent the two treatments, tracing blood pressure fluctuations through pre-dose and several time points up to 24 hours.*
FDA Label Image

Sildenafilfigure2 (Sildenafilfigure2)

Sildenafilfigure2 (Sildenafilfigure2)
Line graph comparing change in systolic blood pressure (mmHg) over time (hours postdose) between placebo and Sildenafil 25 mg dosages. The chart shows data points over an 8-hour period for both groups, with Sildenafil depicting generally lower systolic blood pressure values than placebo throughout most of the timeframe.*
FDA Label Image

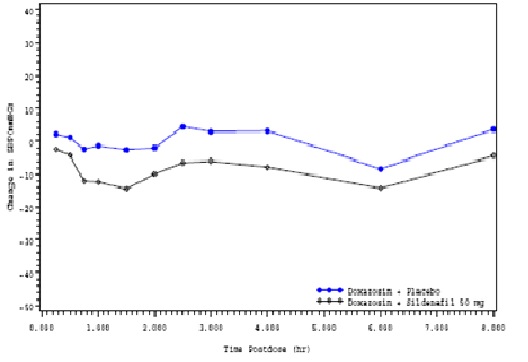
Sildenafilfigure3 (Sildenafilfigure3)

Sildenafilfigure3 (Sildenafilfigure3)
A line graph comparing percentage change in a variable over time (hours) postdose for two treatments: Doxazosin plus placebo and Doxazosin plus Sildenafil 50 mg. Data points are plotted for up to 8 hours, showing distinct trends for each treatment group.*
FDA Label Image

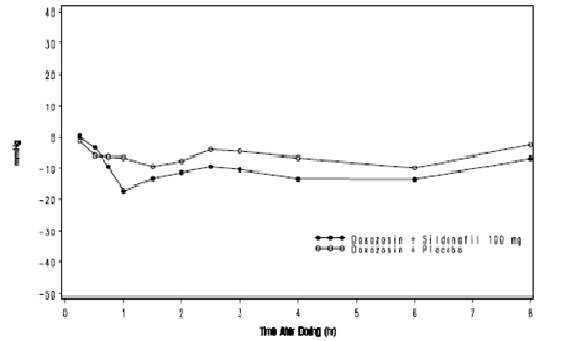
Sildenafilfigure4 (Sildenafilfigure4)

Sildenafilfigure4 (Sildenafilfigure4)
A line graph depicting data over 8 hours post-dose. It compares two groups: one receiving Doxazosin + Sildenafil 100 mg and the other Doxazosin + Placebo. The vertical axis measures a variable in mmHg, and the horizontal axis represents time after dosing in hours.*
FDA Label Image

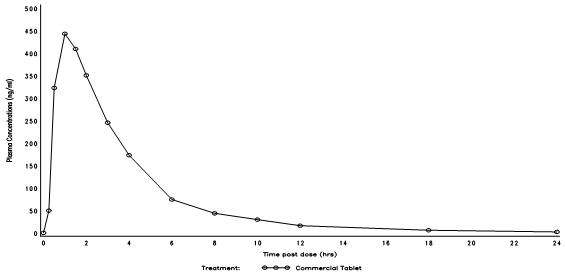
Sildenafilfigure5 (Sildenafilfigure5)

Sildenafilfigure5 (Sildenafilfigure5)
A line graph showing plasma concentration of a drug over time after dosage. The x-axis represents time post dose in hours, ranging from 0 to 24 hours, and the y-axis shows plasma concentration in ng/mL, ranging from 0 to 500 ng/mL. The graph includes data for the treatment labeled as Commercial Tablet, depicted by a line with circular markers showing an initial peak in concentration followed by a gradual decline over time.*
FDA Label Image

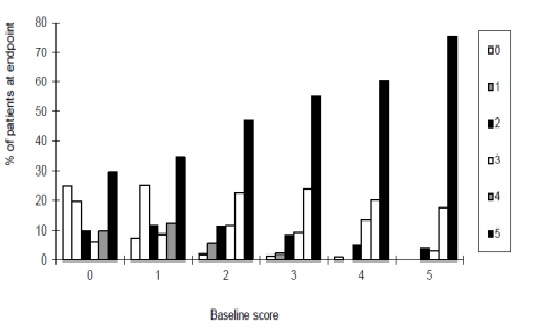
Sildenafilfigure6a (Sildenafilfigure6a)

Sildenafilfigure6a (Sildenafilfigure6a)
A bar chart showing the percentage of patients at endpoint plotted against baseline scores ranging from 0 to 5. Multiple bar groups represent different categories from 0 to 5, with the percentage scale on the vertical axis from 0 to 80%. The chart provides a comparative visual distribution of patient percentages across baseline scores, distinguished by different shading or patterns for each category.*
FDA Label Image

Sildenafilfigure6b (Sildenafilfigure6b)

Sildenafilfigure6b (Sildenafilfigure6b)
A bar chart displaying the percentage of patients at endpoint versus baseline scores ranging from 0 to 5. The chart uses multiple shaded bars to represent different categories or groups labeled from 00 to 05, showing distribution patterns across the baseline scores.*
FDA Label Image

Sildenafilheterologo1 (Sildenafilheterologo1)

Sildenafilheterologo1 (Sildenafilheterologo1)
Sildenafil 50 mg film-coated tablet packaging label, showing the tablet shape and imprint "HETERO". The image displays a white, capsule-shaped tablet with a break line in the center and the imprint on the tablet surface. Labeler information is not visible in the image.*
FDA Label Image

Sildenafilheterologo2 (Sildenafilheterologo2)

FDA Label Image

Sildenafilstructure (Sildenafilstructure)

Sildenafilstructure (Sildenafilstructure)
Chemical structure diagram of sildenafil, showing its molecular components including nitrogen, oxygen, sulfur, and carbon atoms arranged in characteristic rings and chains as part of the active ingredient's chemical makeup.*

* About these descriptions: Image descriptions on this page are generated by automated AI analysis of the product label images from the manufacturer's FDA label submission (SPL). They are provided for reference only and may contain errors or omissions. Always rely on the printed label itself and the official FDA labeling, and consult a pharmacist or healthcare professional with any questions about this product.