Losartan Potassium Tablet, Film Coated
Product Images NDC 71335-1174

6 FDA label images from Bryant Ranch Prepack · Packaging, Regulatory Labels, and Product Appearance

Product Visual Gallery

This gallery contains 6 technical images submitted to the FDA as part of the official labeling for Losartan Potassium (NDC 71335-1174). Unlike standard consumer photos, these assets often include clinical data figures, molecular chemical structures, and official manufacturer packaging layouts.

As provided by Bryant Ranch Prepack, these visuals offer a comprehensive scientific overview of the product's physical and chemical identity, aiding pharmacists and researchers in product verification and study.

FDA Label Image

Label Image (Lbl713351174)
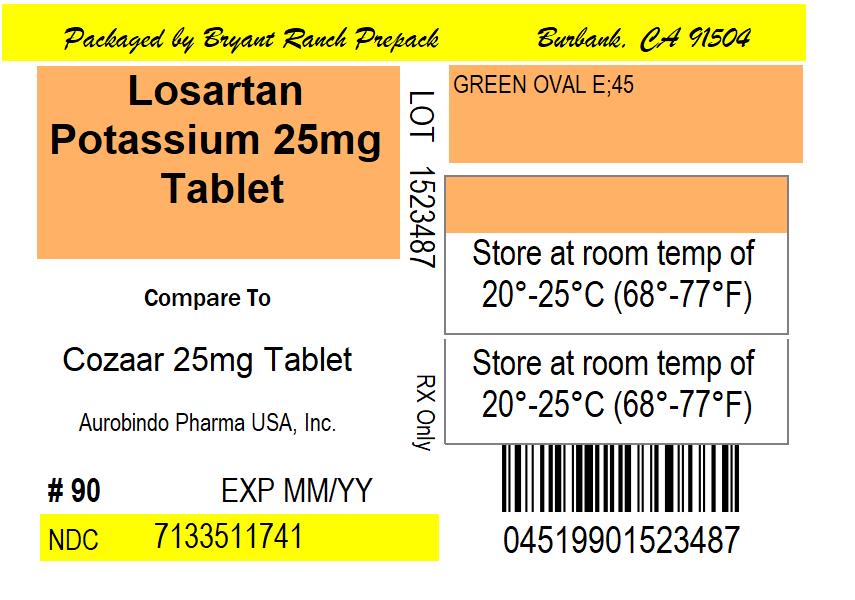
Label Image (Lbl713351174)
Losartan Potassium 25 mg tablet label by Bryant Ranch Prepack, with comparison to Cozaar 25 mg tablet by Aurobindo Pharma USA, Inc. The label includes NDC 71335-1174, storage information at 20°-25°C (68°-77°F), lot number 1523487, and a barcode. The packaging indicates prescription use and a quantity of 90 tablets.*
FDA Label Image

Figure1 (Losartan Fig1)

Figure1 (Losartan Fig1)
A line graph comparing the percentage of patients with the primary endpoint over time between Losartan Potassium and Atenolol. The x-axis shows study months from 0 to 66, and the y-axis shows the percentage of patients, ranging from 0 to 16%. The graph indicates an adjusted risk reduction of 13% for Losartan Potassium with a p-value of 0.021.*
FDA Label Image

Figure2 (Losartan Fig2)

Figure2 (Losartan Fig2)
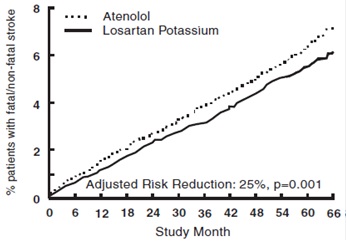
A line graph comparing the percentage of patients with fatal or non-fatal stroke over time between Atenolol and Losartan Potassium. The x-axis represents study months from 0 to 66, and the y-axis represents the percentage of patients from 0 to 8%. The graph indicates Losartan Potassium with a solid line and Atenolol with a dotted line, showing a lower stroke percentage for Losartan Potassium. A note mentions an adjusted risk reduction of 25% with a p-value of 0.001.*
FDA Label Image

Figure 3 (Losartan Fig3)

Figure 3 (Losartan Fig3)
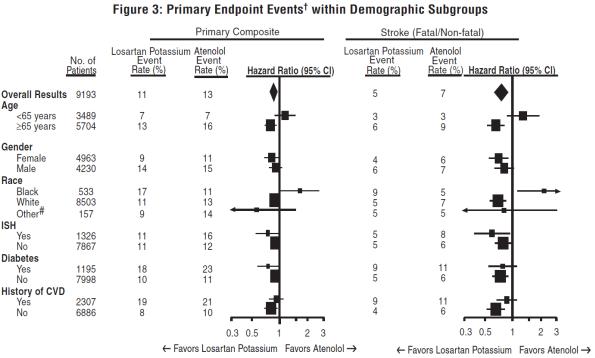
A forest plot chart comparing primary endpoint events by demographic subgroups between Losartan Potassium and Atenolol. The chart separately presents the primary composite and stroke (fatal/non-fatal) event rates, with hazard ratios and 95% confidence intervals across categories such as age, gender, race, insulin sensitivity, diabetes, and cardiovascular disease history. It visually indicates which treatment is favored in each subgroup.*
FDA Label Image

Figure-4 (Losartan Fig4)

Figure-4 (Losartan Fig4)
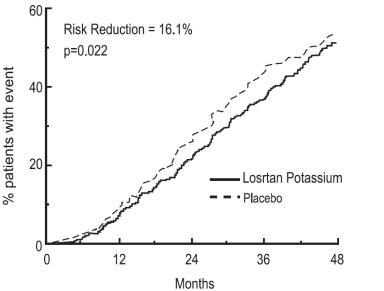
A line graph showing the percentage of patients with an event over a 48-month period comparing Losartan Potassium and placebo. The solid line represents Losartan Potassium, and the dashed line represents placebo. The graph indicates a 16.1% risk reduction with Losartan Potassium, with a p-value of 0.022, plotted against months on the x-axis and percentage of patients on the y-axis.*
FDA Label Image

Chemical Structure (Losartan Str)

Chemical Structure (Losartan Str)
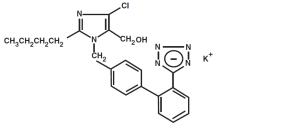
Chemical structure of Losartan Potassium, showing its molecular arrangement including characteristic rings and side chains, with potassium ion (K+) indicated.*

* About these descriptions: Image descriptions on this page are generated by automated AI analysis of the product label images from the manufacturer's FDA label submission (SPL). They are provided for reference only and may contain errors or omissions. Always rely on the printed label itself and the official FDA labeling, and consult a pharmacist or healthcare professional with any questions about this product.