Graph (Figure 1)
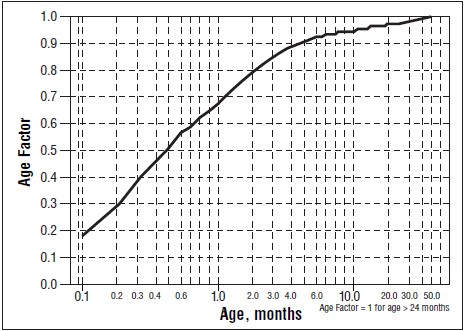
This appears to be a table showing ages and quantities related to forage. The first column likely lists age categories in months, while the second and third columns may indicate the quantity of forage measured in some units. However, without additional context or clearer text, it is impossible to determine the specific details of the data presented.*