Gabapentin Capsule
Product Images NDC 71335-1375

View Photos of Packaging, Regulatory Labels, and Product Appearance

Product Visual Gallery

This gallery contains 7 technical images submitted to the FDA as part of the official labeling for Gabapentin (NDC 71335-1375). Unlike standard consumer photos, these assets often include clinical data figures, molecular chemical structures, and official manufacturer packaging layouts.

As provided by Bryant Ranch Prepack, these visuals offer a comprehensive scientific overview of the product's physical and chemical identity, aiding pharmacists and researchers in product verification and study.

FDA Label Image

Formula (Ab1e0185 B802 4cf2 A5d4 B71f27f1dcb0 00)

Formula (Ab1e0185 B802 4cf2 A5d4 B71f27f1dcb0 00)
An illustration showing the formula for calculating creatinine clearance (CLCr). The formula uses patient age, weight in kilograms, and serum creatinine levels in mg/dL, with a multiplier of 0.85 applied for female patients.*
FDA Label Image

Figure1 (D45f499b 8612 479e 8dd2 4fe28b1f5f9c 01)

Figure1 (D45f499b 8612 479e 8dd2 4fe28b1f5f9c 01)
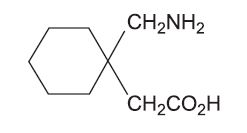
Chemical structure of Gabapentin showing its cyclohexane ring attached to an aminomethyl group and an acetic acid moiety.*
FDA Label Image

Image 1 (D45f499b 8612 479e 8dd2 4fe28b1f5f9c 02)

Image 1 (D45f499b 8612 479e 8dd2 4fe28b1f5f9c 02)
A line graph displaying mean pain score over an 8-week period comparing placebo and Gabapentin 3600 mg/day. The x-axis represents weeks, starting from baseline, and the y-axis represents the mean pain score. The graph distinguishes a 4-week dose titration period followed by a 4-week fixed dose period, showing a decrease in pain scores for Gabapentin compared to placebo.*
FDA Label Image

Image 2 (D45f499b 8612 479e 8dd2 4fe28b1f5f9c 03)

Image 2 (D45f499b 8612 479e 8dd2 4fe28b1f5f9c 03)
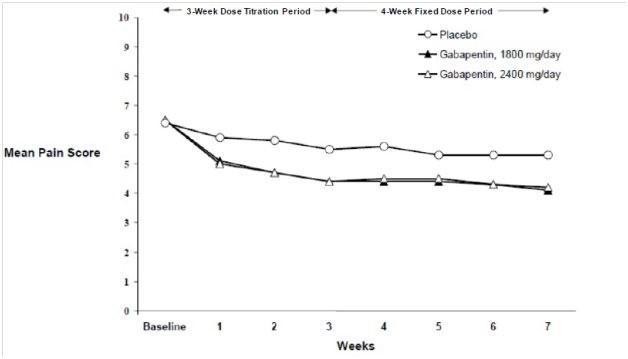
A line graph showing mean pain scores over a 7-week period comparing placebo and two doses of Gabapentin (1800 mg/day and 2400 mg/day). The x-axis represents weeks, including baseline, and the y-axis represents mean pain score. The graph includes a 3-week dose titration period followed by a 4-week fixed dose period. Both Gabapentin doses show a decrease in mean pain score compared to placebo.*
FDA Label Image

Image 3 (D45f499b 8612 479e 8dd2 4fe28b1f5f9c 04)

Image 3 (D45f499b 8612 479e 8dd2 4fe28b1f5f9c 04)
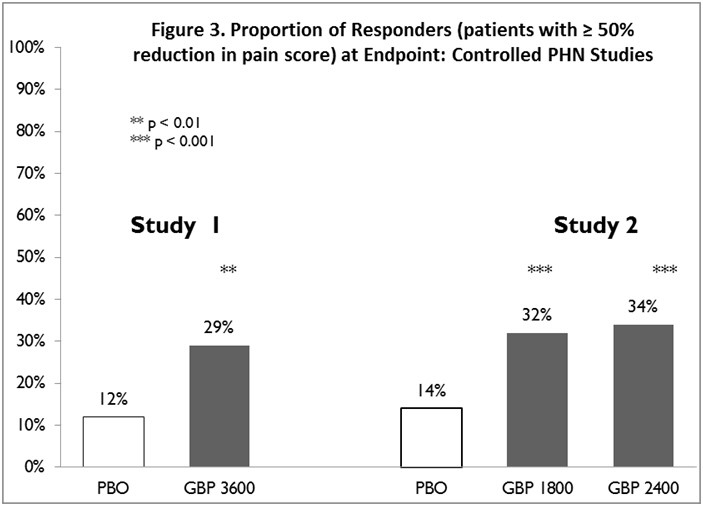
A bar graph titled 'Proportion of Responders (patients with ≥ 50% reduction in pain score) at Endpoint: Controlled PHN Studies' compares two studies. Study 1 shows placebo (PBO) at 12% and Gabapentin 3600 mg (GBP 3600) at 29%. Study 2 shows placebo at 14%, Gabapentin 1800 mg at 32%, and Gabapentin 2400 mg at 34%. Statistical significance markers indicate p-values less than 0.01 and 0.001 for the Gabapentin groups versus placebo.*
FDA Label Image

Image 4 (D45f499b 8612 479e 8dd2 4fe28b1f5f9c 05)

Image 4 (D45f499b 8612 479e 8dd2 4fe28b1f5f9c 05)
A scatter plot showing the difference percentage on the y-axis against daily gabapentin dose in milligrams on the x-axis for three studies labeled a, b, and c. Each study is represented by different colored squares plotted at doses 600 mg, 900 mg, 1200 mg, and 1800 mg. Differences range from about 7% to 18%.*
FDA Label Image

Label (Lbl713351375)

Label (Lbl713351375)
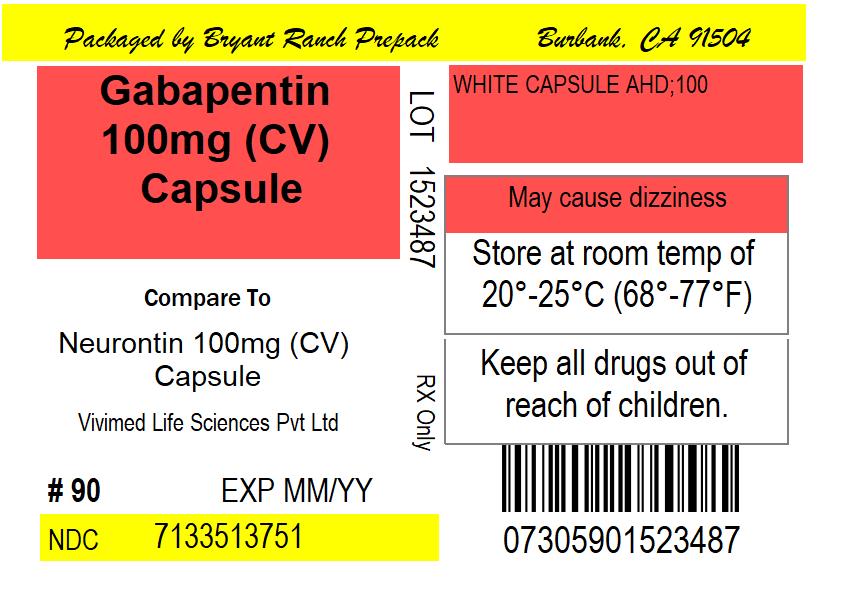
Gabapentin 100 mg capsule label from Bryant Ranch Prepack. The label indicates it is a white capsule, references Neurontin 100 mg capsule as a comparison, and includes storage instructions to keep at room temperature (20°-25°C/68°-77°F) and out of reach of children. The package contains 90 capsules and is marked RX Only.*

* About these descriptions: Image descriptions on this page are generated by automated AI analysis of the product label images from the manufacturer's FDA label submission (SPL). They are provided for reference only and may contain errors or omissions. Always rely on the printed label itself and the official FDA labeling, and consult a pharmacist or healthcare professional with any questions about this product.