Figure-1 (Figure 1)
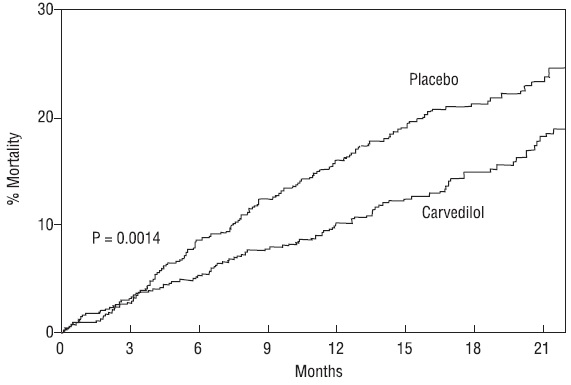
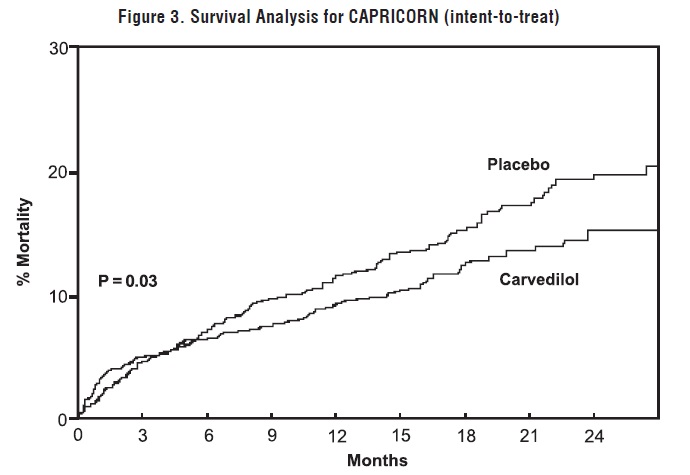
This appears to be a graph that compares the effectiveness of a medication (Carvedilol) to a placebo. The "P=0.0014" suggests that this medication is statistically significant in comparison to the placebo. The numbers on the bottom seem to refer to time increments (3, 6, 9, 12, 15,18, and 21). However, without further context or visual inspection of the graph itself, it is difficult to provide a more in-depth description of its content.*