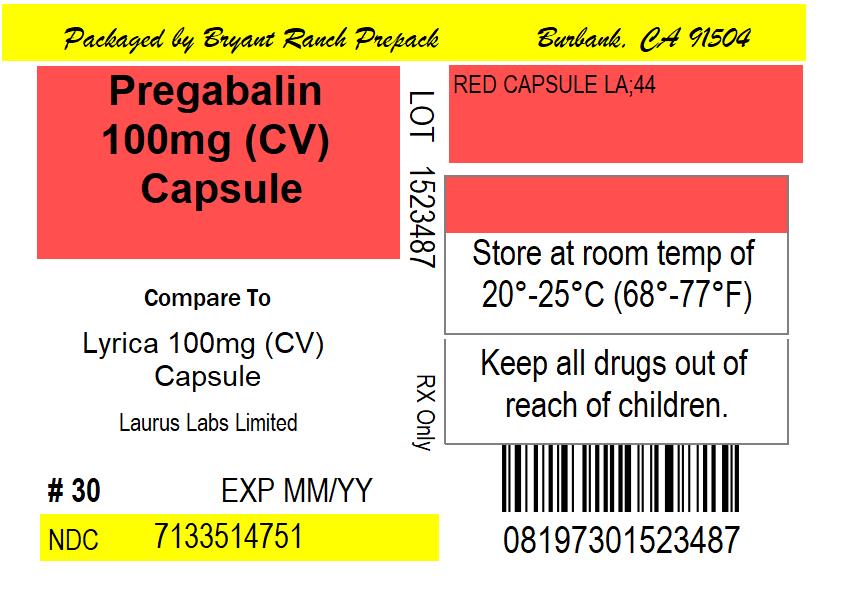
Label (Lbl713351475)
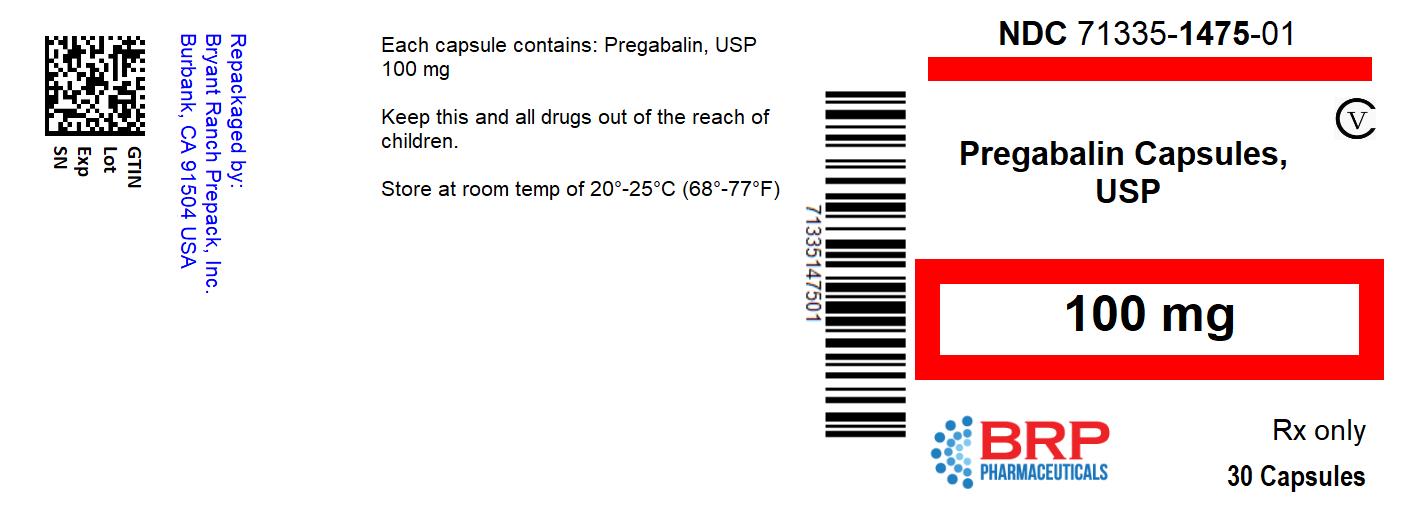
These are Pregabalin capsules with a capacity of 100mg, produced by a company called NILD. They come in a package of 30 capsules and are only available by prescription. The package bears a National Drug Code (NDC) number of 71335-1475-01. It is important to store the capsules at room temperature between 20°C-25°C (68°F-77°F) and away from children.*