Letrozole Tablet
Product Images NDC 71335-1526

7 FDA label images from Bryant Ranch Prepack · Packaging, Regulatory Labels, and Product Appearance

Product Visual Gallery

This gallery contains 7 technical images submitted to the FDA as part of the official labeling for Letrozole (NDC 71335-1526). Unlike standard consumer photos, these assets often include clinical data figures, molecular chemical structures, and official manufacturer packaging layouts.

As provided by Bryant Ranch Prepack, these visuals offer a comprehensive scientific overview of the product's physical and chemical identity, aiding pharmacists and researchers in product verification and study.

FDA Label Image

Label Image (Lbl713351526)
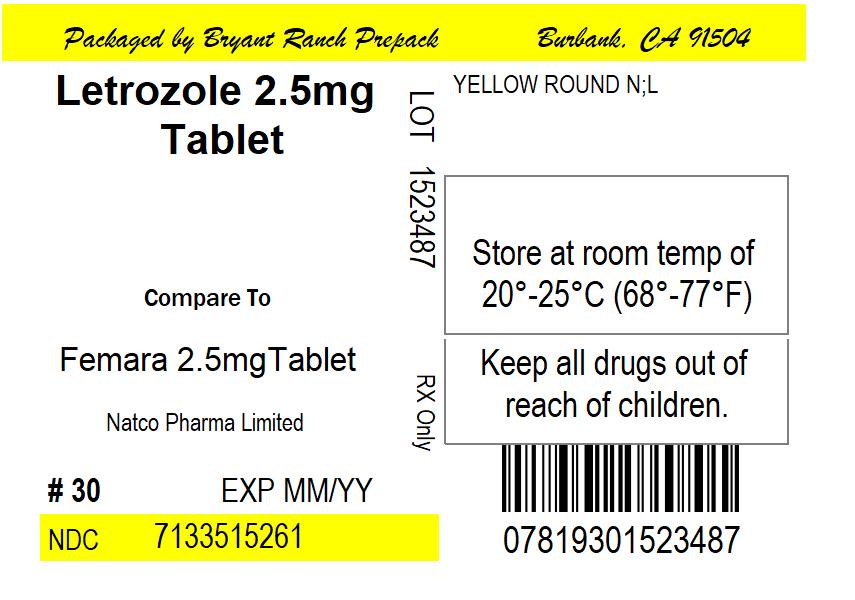
Label Image (Lbl713351526)
LETROZOLE 2.5 mg tablet label showing a yellow round tablet form. The label notes packaging by Bryant Ranch Prepack in Burbank, CA, and includes the NDC 71335-1526-1. It states comparison to Femara 2.5 mg tablet by Natco Pharma Limited and storage instructions at 20°-25°C (68°-77°F). The label also warns to keep all drugs out of reach of children and includes a barcode and lot number.*
FDA Label Image

Chemical Structure (Letrozole 01)

Chemical Structure (Letrozole 01)
Chemical structure of Letrozole depicted as a molecular diagram showing two cyanophenyl rings and a triazole ring connected centrally.*
FDA Label Image

Figure 1 (Letrozole 02)

Figure 1 (Letrozole 02)
A survival curve graph comparing Letrozole and Tamoxifen treatments over 72 months. The solid line represents Letrozole, and the dashed line represents Tamoxifen. The graph includes the number of patients, events, and censored data for each treatment group, along with the number of patients at risk at various time points. The y-axis shows the survival probability from 0 to 1, and the x-axis displays time in months from 0 to 72.*
FDA Label Image

Figure 2 (Letrozole 03)

Figure 2 (Letrozole 03)
A Kaplan-Meier plot illustrating progression-free survival over months for two treatments: Letrozole tablets 2.5 mg and tamoxifen 20 mg. The y-axis represents the proportion of progression-free patients, and the x-axis shows time in months up to 60. The plot compares the progression-free rates between the two treatments over time.*
FDA Label Image

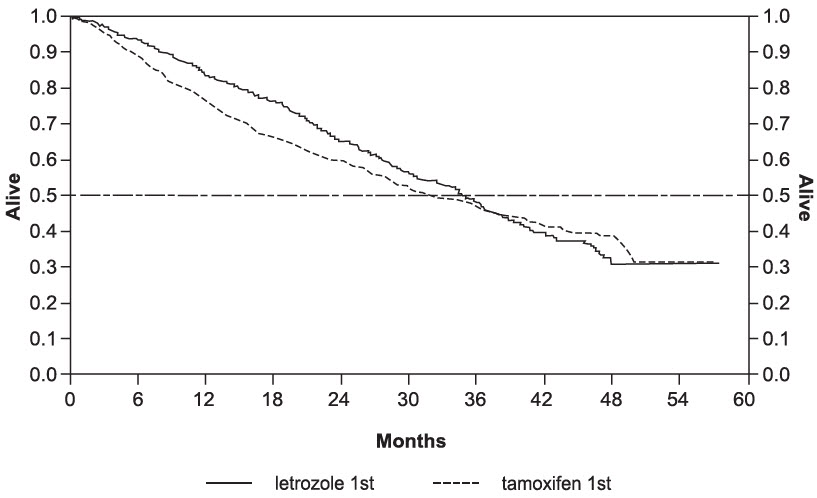
Figure 3 (Letrozole 04)

Figure 3 (Letrozole 04)
A survival curve comparing 'letrozole 1st' and 'tamoxifen 1st' treatment groups over a period of 0 to 60 months. The y-axis represents the proportion alive, ranging from 0.0 to 1.0, while the x-axis indicates time in months. A horizontal line marks the 0.5 survival level for reference. The chart shows the decline in survival proportion over time for both treatments, with letrozole depicted by a solid line and tamoxifen by a dashed line.*
FDA Label Image

Figure 4 (Letrozole 05)

Figure 4 (Letrozole 05)
Survival curve chart showing time to progression in days for different treatment groups. The x-axis represents time to progression in days, ranging from 0 to 1000, while the y-axis shows the proportion of subjects without progression from 0 to 1. Three treatment groups are compared: Letrozole Tablets 0.5 mg, Letrozole Tablets 2.5 mg, and MA.*
FDA Label Image

Figure 5 (Letrozole 06)

Figure 5 (Letrozole 06)
This chart depicts a survival curve showing time to progression in days for different treatment groups. The x-axis represents time to progression in days up to 1000 days, and the y-axis shows the proportion remaining without progression. The chart compares Letrozole tablets at 0.5 mg, 2.5 mg, and another group labeled AG, using different line styles for each group.*

* About these descriptions: Image descriptions on this page are generated by automated AI analysis of the product label images from the manufacturer's FDA label submission (SPL). They are provided for reference only and may contain errors or omissions. Always rely on the printed label itself and the official FDA labeling, and consult a pharmacist or healthcare professional with any questions about this product.